
この戦略は,動的張指数と123形状の2つの戦略を組み合わせて,総合的な取引シグナルを形成し,利益の確率を向上させます. その中で,動的張指数は,市場の波動性を追跡し,短期的なトレンドをキャプチャするためにRSIパラメータを調整します.123形状は,株式の短期間の高点,低点を利用して取引シグナルを形成します.
123形は3段階に分かれ,第1段階では株価が2日連続で下落し,次に第2段階では株価が2日連続で上昇し,最後に第3段階では株価が再び下落する.この形によって,第2段階では株価が上昇するときに多頭ポジションを確立でき,第3段階では株価が下落するときに空頭ポジションを確立できることが判断できる.
具体的には,閉盘価格が2日連続で下落した後,3日目の閉盘価格が前日の閉盘価格より高く,同時に9日目のストキャスティック・スローが50より低ければ,買入シグナルとして;閉盘価格が2日連続で上昇した後,3日目の閉盘価格が前日の閉盘価格より低ければ,同時に9日目のストキャスティック・ファストが50より高ければ,売出シグナルとして.
動量張指数の構築プロセスは,RSIとほぼ同じである.主な違いは,動量張指数の周期長さが変動していることである.具体的には,この指数の周期長さは,最近の価格変動率に影響される.価格変動が大きいほど,周期が短いので,指標はより敏感になる.価格が安定する場合は,誤報率を減らすために周期が長い.
動量張指数の計算式は:
DMI = RSI(DTime)
其中:
DTime = 14 / X日收盘价标准差的10日均值
この指標は,RSIの定義範囲と同じで,多空領域は次のとおりです.
多頭部地域:DMI > 30 空頭領域:DMI < 70
指数は空頭領域から多頭領域へ入るときに買い信号を生成し,多頭領域から空頭領域へ入るときに売り信号を生成する.
123形はシンプルで有効である。この形は,株価の短期反転特性を利用し,次級の底で買い,次級のトップで売り,トレンドの中間期間の取引を避ける。
動量張指数はより敏感である.指数の変速特性により,市場に自律的に適応し,激しい変動の時にターニングポイントをタイムリーに捕捉することができる.
この2つの戦略は,誤報を効果的にフィルターする.123形がシグナルを生成する際には,DMIを参考にして市場の背景を判断し,トレンド中に取引がもたらす損失を減らすことができます.
2つの戦略の優位性を利用する.DMIはフィルターとして使用するのに適しており,123形状を組み合わせると,システムの安定性を大幅に向上させることができる.
信号誤報の発生に容易である.DMIと123形態は,価格が短期的な変動のみで,転換していない場合に誤信号を発生させる可能性がある.
取引頻度は高すぎます.DMIの変周期特性により,市場騒音に非常に敏感になり,取引頻度を制御するためにパラメータを適切に調整する必要があります.
123形はトレンドの中間期を逃した可能性がある。この形は,主に短期的な逆転を捕捉し,中長期の動きから継続的に利益を得ることができない。
取引の回数を適切に制限する必要があります. 取引の回数が多すぎると,手数料とスライドポイントのコストが高くなります.
動量張指数パラメータの最適化 異なるDMIのRSIパラメータ,取引区間のパラメータをテストして最適なパラメータの組み合わせを見つける
123形状のフィルタリング条件を最適化します.Stoch指標の異なるパラメータまたはMACDのような他のフィルタリング指標をテストできます.
ストップ・メカニズムを増やす.適切なストップ・幅を縮小することで,単一の損失を減らすことができる.
ポジション管理モジュールを追加する.例えば,固定数量取引,固定資金活用率取引などの戦略的リスク管理を完善することができる.
この戦略は,動量張指数と123形状を組み合わせて2つの角度から市場を判断し,取引シグナルの効果を向上させることを目的としています.しかし,いかなる単一の戦略も市場の変化に完璧に適応することはできません.投資家は,使用する際にリスクを制御することに注意し,反測と実盤の結果に基づいて最適化パラメータを継続的に調整し,戦略を継続的に収益化できるようにする必要があります.
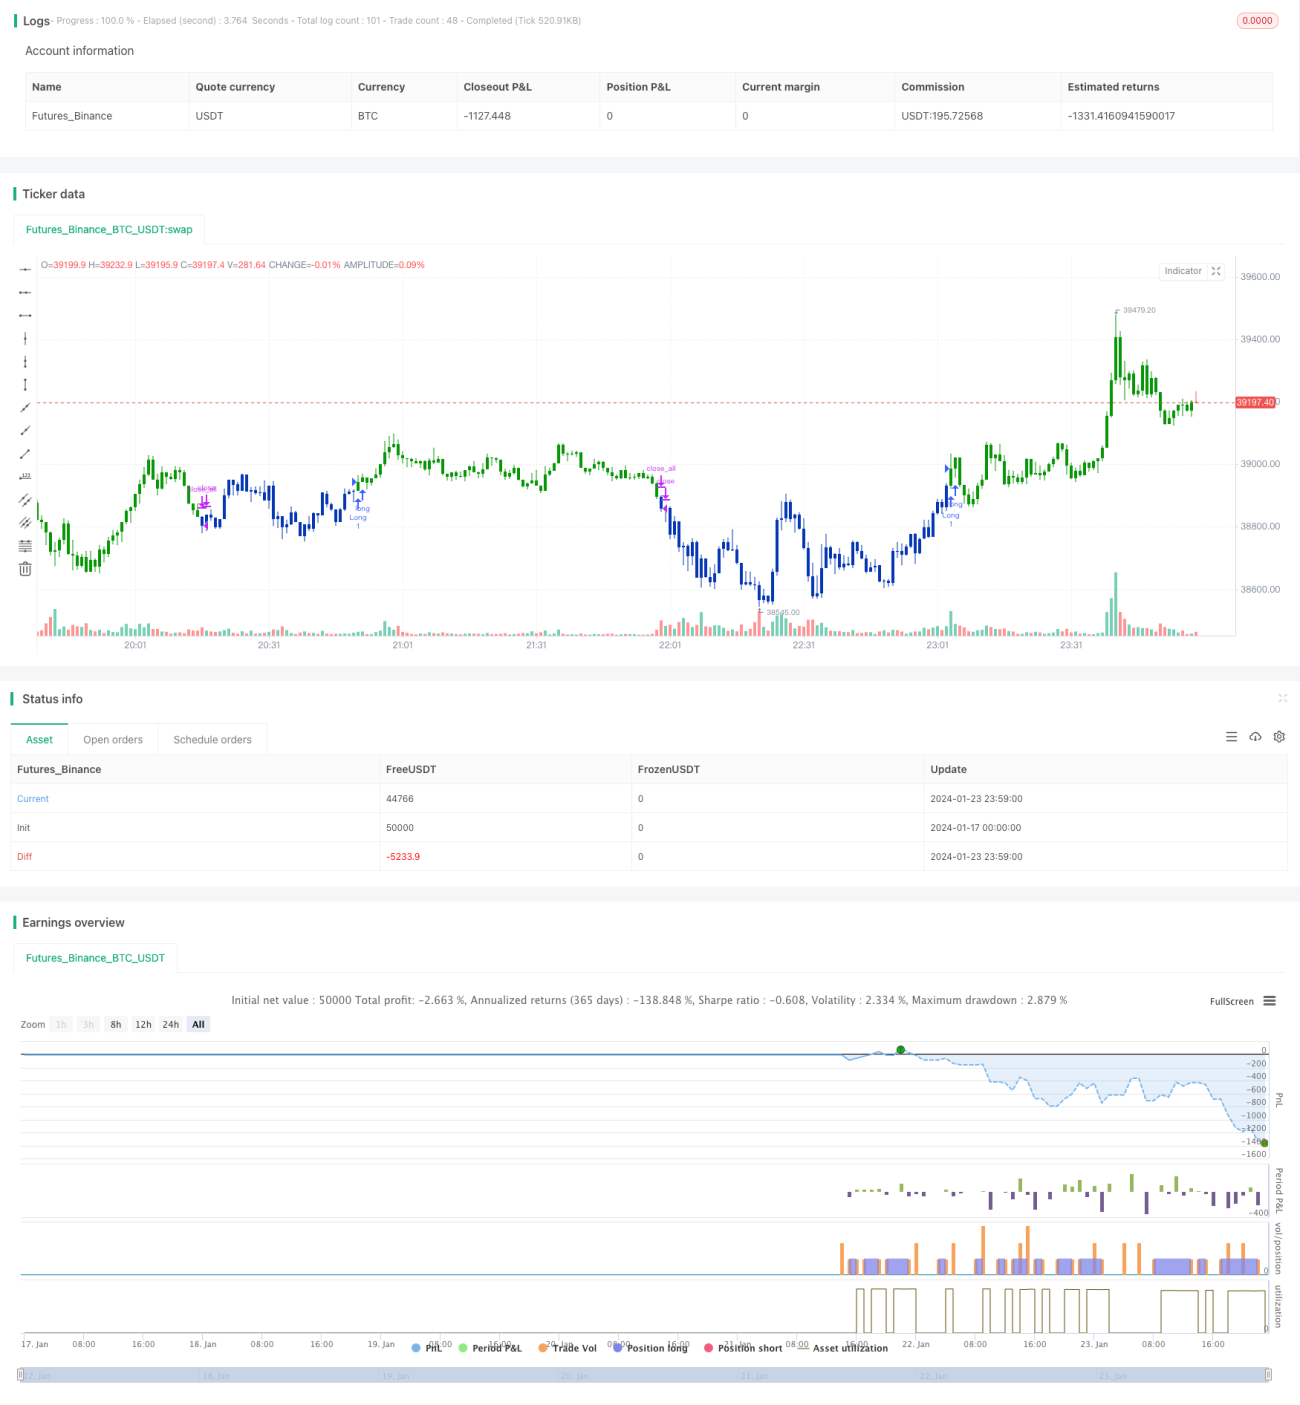
/*backtest
start: 2024-01-17 00:00:00
end: 2024-01-24 00:00:00
period: 1m
basePeriod: 1m
exchanges: [{"eid":"Futures_Binance","currency":"BTC_USDT"}]
*/
//@version=4
////////////////////////////////////////////////////////////
// Copyright by HPotter v1.0 18/03/2020
// This is combo strategies for get a cumulative signal.
//
// First strategy
// This System was created from the Book "How I Tripled My Money In The
// Futures Market" by Ulf Jensen, Page 183. This is reverse type of strategies.
// The strategy buys at market, if close price is higher than the previous close
// during 2 days and the meaning of 9-days Stochastic Slow Oscillator is lower than 50.
// The strategy sells at market, if close price is lower than the previous close price
// during 2 days and the meaning of 9-days Stochastic Fast Oscillator is higher than 50.
//
// Second strategy
// This indicator plots Dynamic Momentum Index indicator. The Dynamic Momentum
// Index (DMI) was developed by Tushar Chande and Stanley Kroll. The indicator
// is covered in detail in their book The New Technical Trader.
// The DMI is identical to Welles Wilder`s Relative Strength Index except the
// number of periods is variable rather than fixed. The variability of the time
// periods used in the DMI is controlled by the recent volatility of prices.
// The more volatile the prices, the more sensitive the DMI is to price changes.
// In other words, the DMI will use more time periods during quiet markets, and
// less during active markets. The maximum time periods the DMI can reach is 30
// and the minimum is 3. This calculation method is similar to the Variable
// Moving Average, also developed by Tushar Chande.
// The advantage of using a variable length time period when calculating the RSI
// is that it overcomes the negative effects of smoothing, which often obscure short-term moves.
// The volatility index used in controlling the time periods in the DMI is based
// on a calculation using a five period standard deviation and a ten period average
// of the standard deviation.
//
// WARNING:
// - For purpose educate only
// - This script to change bars colors.
////////////////////////////////////////////////////////////
Reversal123(Length, KSmoothing, DLength, Level) =>
vFast = sma(stoch(close, high, low, Length), KSmoothing)
vSlow = sma(vFast, DLength)
pos = 0.0
pos := iff(close[2] < close[1] and close > close[1] and vFast < vSlow and vFast > Level, 1,
iff(close[2] > close[1] and close < close[1] and vFast > vSlow and vFast < Level, -1, nz(pos[1], 0)))
pos
DMI(RSILen, BuyZone,SellZone,UpLimit,LoLimit) =>
pos = 0
xStdDev = stdev(close, 5)
xSMAStdDev = sma(xStdDev, 10)
DTime = round(14 / xSMAStdDev - 0.5)
xDMI = iff(DTime > UpLimit, UpLimit,
iff(DTime < LoLimit, LoLimit, DTime))
xRSI = rsi(xDMI, RSILen)
pos := iff(xRSI > BuyZone, 1,
iff(xRSI < SellZone, -1, nz(pos[1], 0)))
pos
strategy(title="Combo Backtest 123 Reversal & Dynamic Momentum Index", shorttitle="Combo", overlay = true)
Length = input(14, minval=1)
KSmoothing = input(1, minval=1)
DLength = input(3, minval=1)
Level = input(50, minval=1)
//-------------------------
RSILen = input(14, minval=1)
BuyZone = input(30, minval=1)
SellZone = input(70, minval=1)
UpLimit = input(30, minval=1)
LoLimit = input(5, minval=1)
reverse = input(false, title="Trade reverse")
posReversal123 = Reversal123(Length, KSmoothing, DLength, Level)
posDMI = DMI(RSILen, BuyZone,SellZone,UpLimit,LoLimit)
pos = iff(posReversal123 == 1 and posDMI == 1 , 1,
iff(posReversal123 == -1 and posDMI == -1, -1, 0))
possig = iff(reverse and pos == 1, -1,
iff(reverse and pos == -1 , 1, pos))
if (possig == 1)
strategy.entry("Long", strategy.long)
if (possig == -1)
strategy.entry("Short", strategy.short)
if (possig == 0)
strategy.close_all()
barcolor(possig == -1 ? #b50404: possig == 1 ? #079605 : #0536b3 )