ADX指標に基づく原油トレンド追従戦略
作成日:
2024-01-25 15:18:15
最終変更日:
2024-01-25 15:18:15
コピー:
3
クリック数:
795
1
フォロー
1750
フォロワー
概要
この戦略は,ケビン・デイヴィーの無料原油期貨取引戦略を改造したものです. この戦略は,ADX指標を使用して原油市場の傾向を判断し,価格突破の原則と組み合わせて,簡単な実用的な原油自動取引戦略を実現しています.
戦略原則
- 14サイクルADXの計算
- ADX>10の場合は,トレンドだと考えます
- 65K線前の閉店価格より高い場合は,価格が突破したことを示し,長期ポジションのシグナルです.
- 65K線前の閉店価格より低い閉店価格であれば,価格の突破を示し,ショートポジションのシグナル
- 入力後に停止と停止を設定する
この戦略はADX指数によるトレンド判断に大きく依存し,トレンドの場合,固定周期の価格突破に基づいて取引シグナルを生成する.全戦略の論理は非常にシンプルで明確である.
戦略的優位分析
- ADXでトレンドを判断し,トレンドの機会を逃さないために
- 固定周期価格突破が信号を生じ,反測効果が優れている.
- コードは直感的で簡潔で,理解し,修正しやすい.
- Kevin Daveyは長年に渡って,非曲線適合を検証しています.
戦略的リスク分析
- ADXは主要指標として,パラメータ選択と突破周期選択に敏感である
- 固定サイクルを突破する機会を逃した
- ストップ・ストップを正しく設定しないと損失が増加する可能性があります.
- リアルディスク効果と反測の違いの可能性
戦略最適化の方向性
- ADXパラメータと突破周期を最適化する
- ポジションの動態調整
- 継続的な改定と改善
- 機械学習と深層学習技術を導入し,戦略を最適化する
要約する
この戦略は,全体的に非常に実用的な原油取引戦略である. ADX指標を使用してトレンドを判断することは非常に合理的で,価格突破原理は簡単で有効で,反省効果は良好である. また,ケビン・デイヴィーの公開無料戦略であるため,強力な実用的な信頼性がある. この戦略には一定の改善の余地があるが,初心者および小資本トレーダーにとって,この戦略は入門と実践に非常に適した選択肢である.
ストラテジーソースコード
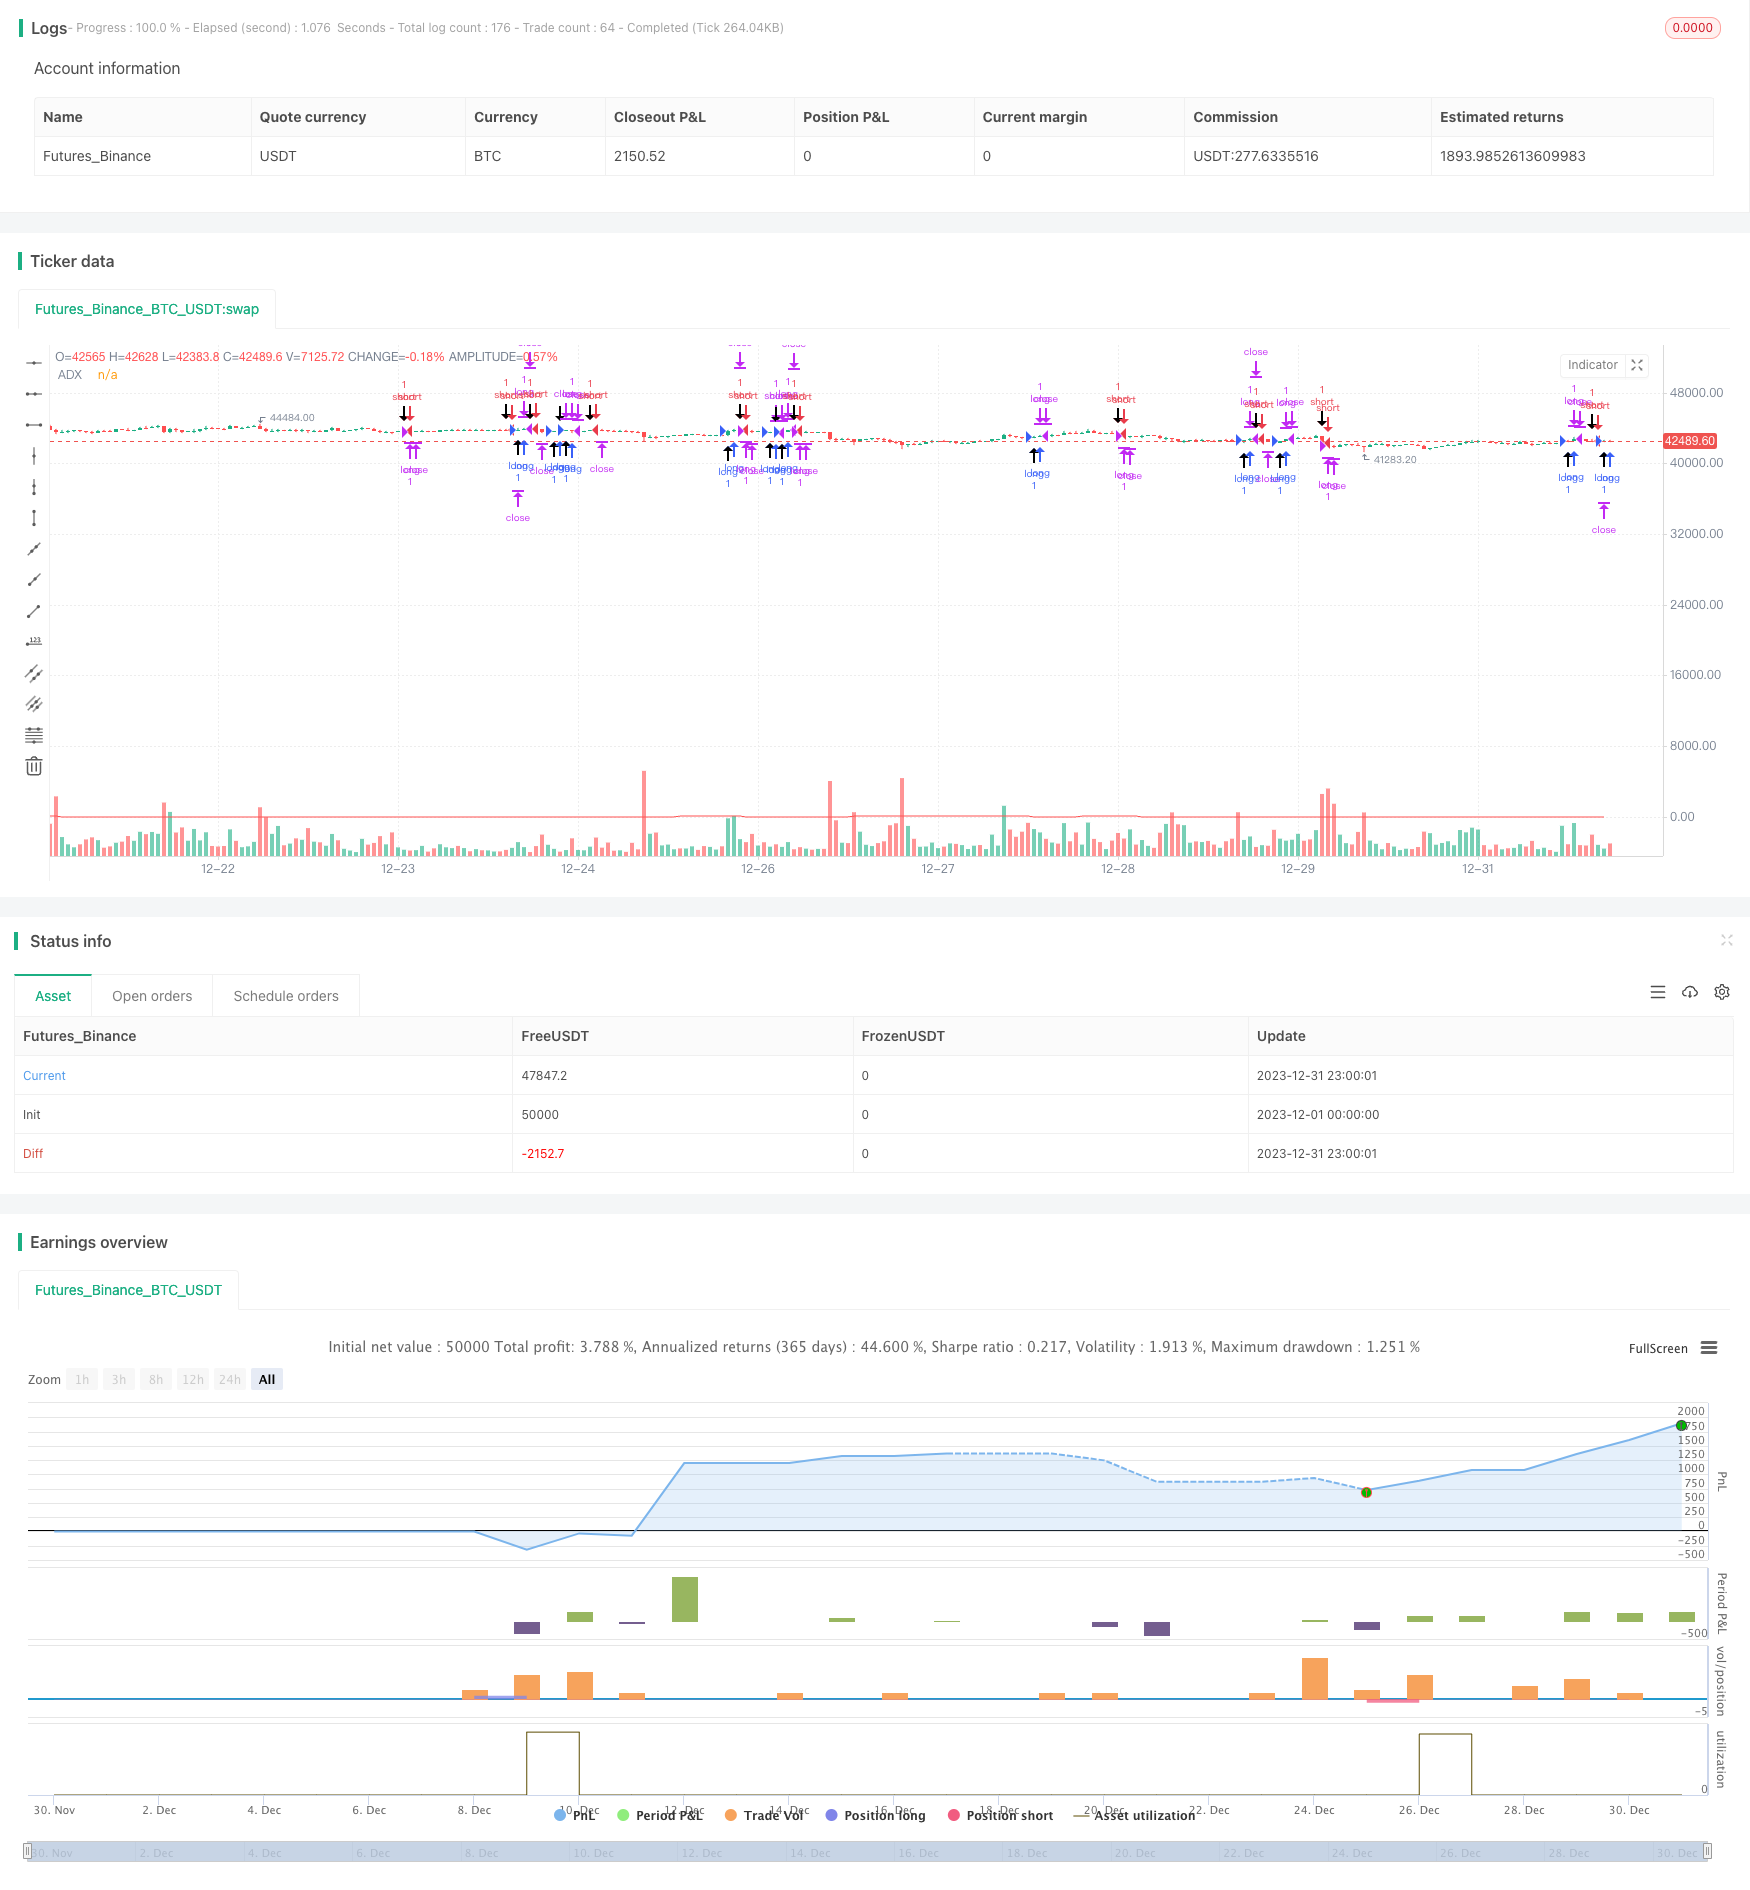
/*backtest
start: 2023-12-01 00:00:00
end: 2023-12-31 23:59:59
period: 1h
basePeriod: 15m
exchanges: [{"eid":"Futures_Binance","currency":"BTC_USDT"}]
*/

// Strategy idea coded from EasyLanguage to Pinescript
//@version=5
strategy("Kevin Davey Crude free crude oil strategy", shorttitle="CO Fut", format=format.price, precision=2, overlay = true, calc_on_every_tick = true)
adxlen = input(14, title="ADX Smoothing")
dilen = input(14, title="DI Length")
dirmov(len) =>
	up = ta.change(high)
	down = -ta.change(low)
	plusDM = na(up) ? na : (up > down and up > 0 ? up : 0)
	minusDM = na(down) ? na : (down > up and down > 0 ? down : 0)
	truerange = ta.rma(ta.tr, len)
	plus = fixnan(100 * ta.rma(plusDM, len) / truerange)
	minus = fixnan(100 * ta.rma(minusDM, len) / truerange)
	[plus, minus]
adx(dilen, adxlen) =>
	[plus, minus] = dirmov(dilen)
	sum = plus + minus
	adx = 100 * ta.rma(math.abs(plus - minus) / (sum == 0 ? 1 : sum), adxlen)
sig = adx(dilen, adxlen)
plot(sig, color=color.red, title="ADX")

buy = sig > 10 and (close - close[65]) > 0 and (close - close[65])[1] < 0
sell = sig > 10 and (close - close[65]) < 0 and (close - close[65])[1] > 0

plotshape(buy, style = shape.arrowup, location = location.belowbar,size = size.huge)
plotshape(sell, style = shape.arrowdown, location = location.abovebar,size = size.huge)

if buy
	strategy.entry("long", strategy.long)
if sell
	strategy.entry("short", strategy.short)

if strategy.position_size != 0
	strategy.exit("long", profit = 450, loss = 300)
	strategy.exit("short", profit = 450, loss = 300)


// GetTickValue() returns the currency value of the instrument's
// smallest possible price movement.
GetTickValue() =>
    syminfo.mintick * syminfo.pointvalue

// On the last historical bar, make a label to display the
// instrument's tick value
if barstate.islastconfirmedhistory
    label.new(x=bar_index + 1, y=close, style=label.style_label_left,
         color=color.black, textcolor=color.white, size=size.large,
         text=syminfo.ticker + " has a tick value of:\n" +
             syminfo.currency + " " + str.tostring(GetTickValue()))