サポートとレジスタンスのスイングトレード戦略
作成日:
2024-01-25 15:53:06
最終変更日:
2024-01-25 15:53:06
コピー:
2
クリック数:
603
1
フォロー
1750
フォロワー
概要
この戦略は,RSI,ランダムな指標の交差策と平仓滑点最適化策を組み合わせて,取引論理の精密な制御と正確なストップロスを実現する.同時に,シグナル最適化を導入することにより,トレンドをよりよく掌握し,資金の合理的な管理を実現することができる.
戦略原則
- RSI指数は,超買超売り領域を判断し,ランダムな指数K値とD値の金叉死叉を組み合わせて取引信号を形成する.
- K線のタイプ識別を導入し,トレンド信号を判断し,誤った取引を回避する.
- SMA平均線はトレンドの方向を判断するのに役立つ.短期平均線が下から上へと長期平均線を突破すると看板信号である.
- 平仓滑点策略,最高価格と最低価格の波動範囲に基づいてストップ・ロスのストップ・ストップ価格を設定する.
優位分析
- RSI指標のパラメータを最適化して,超買超売の領域を判断し,誤った取引を避ける
- STO指数パラメータの最適化,滑らか度パラメータの調節,ノイズを排除し,信号品質を向上させる
- Heikin-Ashi技術分析を導入し,K線実体方向の変化を識別し,取引信号の正確性を確保する
- SMA平均線は,大トレンドの方向を判断し,逆転取引を避けるのに役立ちます.
- ストップ・ストップ・ストラスト・スライドポイント戦略と組み合わせて,取引毎の利益を最大限にロックできます.
リスク分析
- 市場が落ち続けると,資金が大きなリスクにさらされます.
- 取引頻度が高くなり,取引コストとスライドポイントコストが増加する可能性があります.
- RSIは偽の信号を発生しやすいので,他の指標と組み合わせてフィルターする必要があります.
戦略の最適化
- RSIのパラメータを調整し,超買超売判断を最適化する
- STO指数パラメータ,平滑度,周期を調整し,信号品質を向上させる
- 移動平均周期を調整し,トレンド判断を最適化する
- 信号判断の精度を向上させるための技術指標の導入
- ストップ・ストップ比を最適化し,単一取引リスクを低減する
要約する
この戦略は,複数の主流の技術指標の優位性を統合し,パラメータの最適化と規則の完善により,取引信号の質とストップ・ストップ・ロスのバランスを実現する.一定の普遍性と安定した収益性を有する.継続的な最適化により,さらに勝利率と収益率を向上させることができる.
ストラテジーソースコード
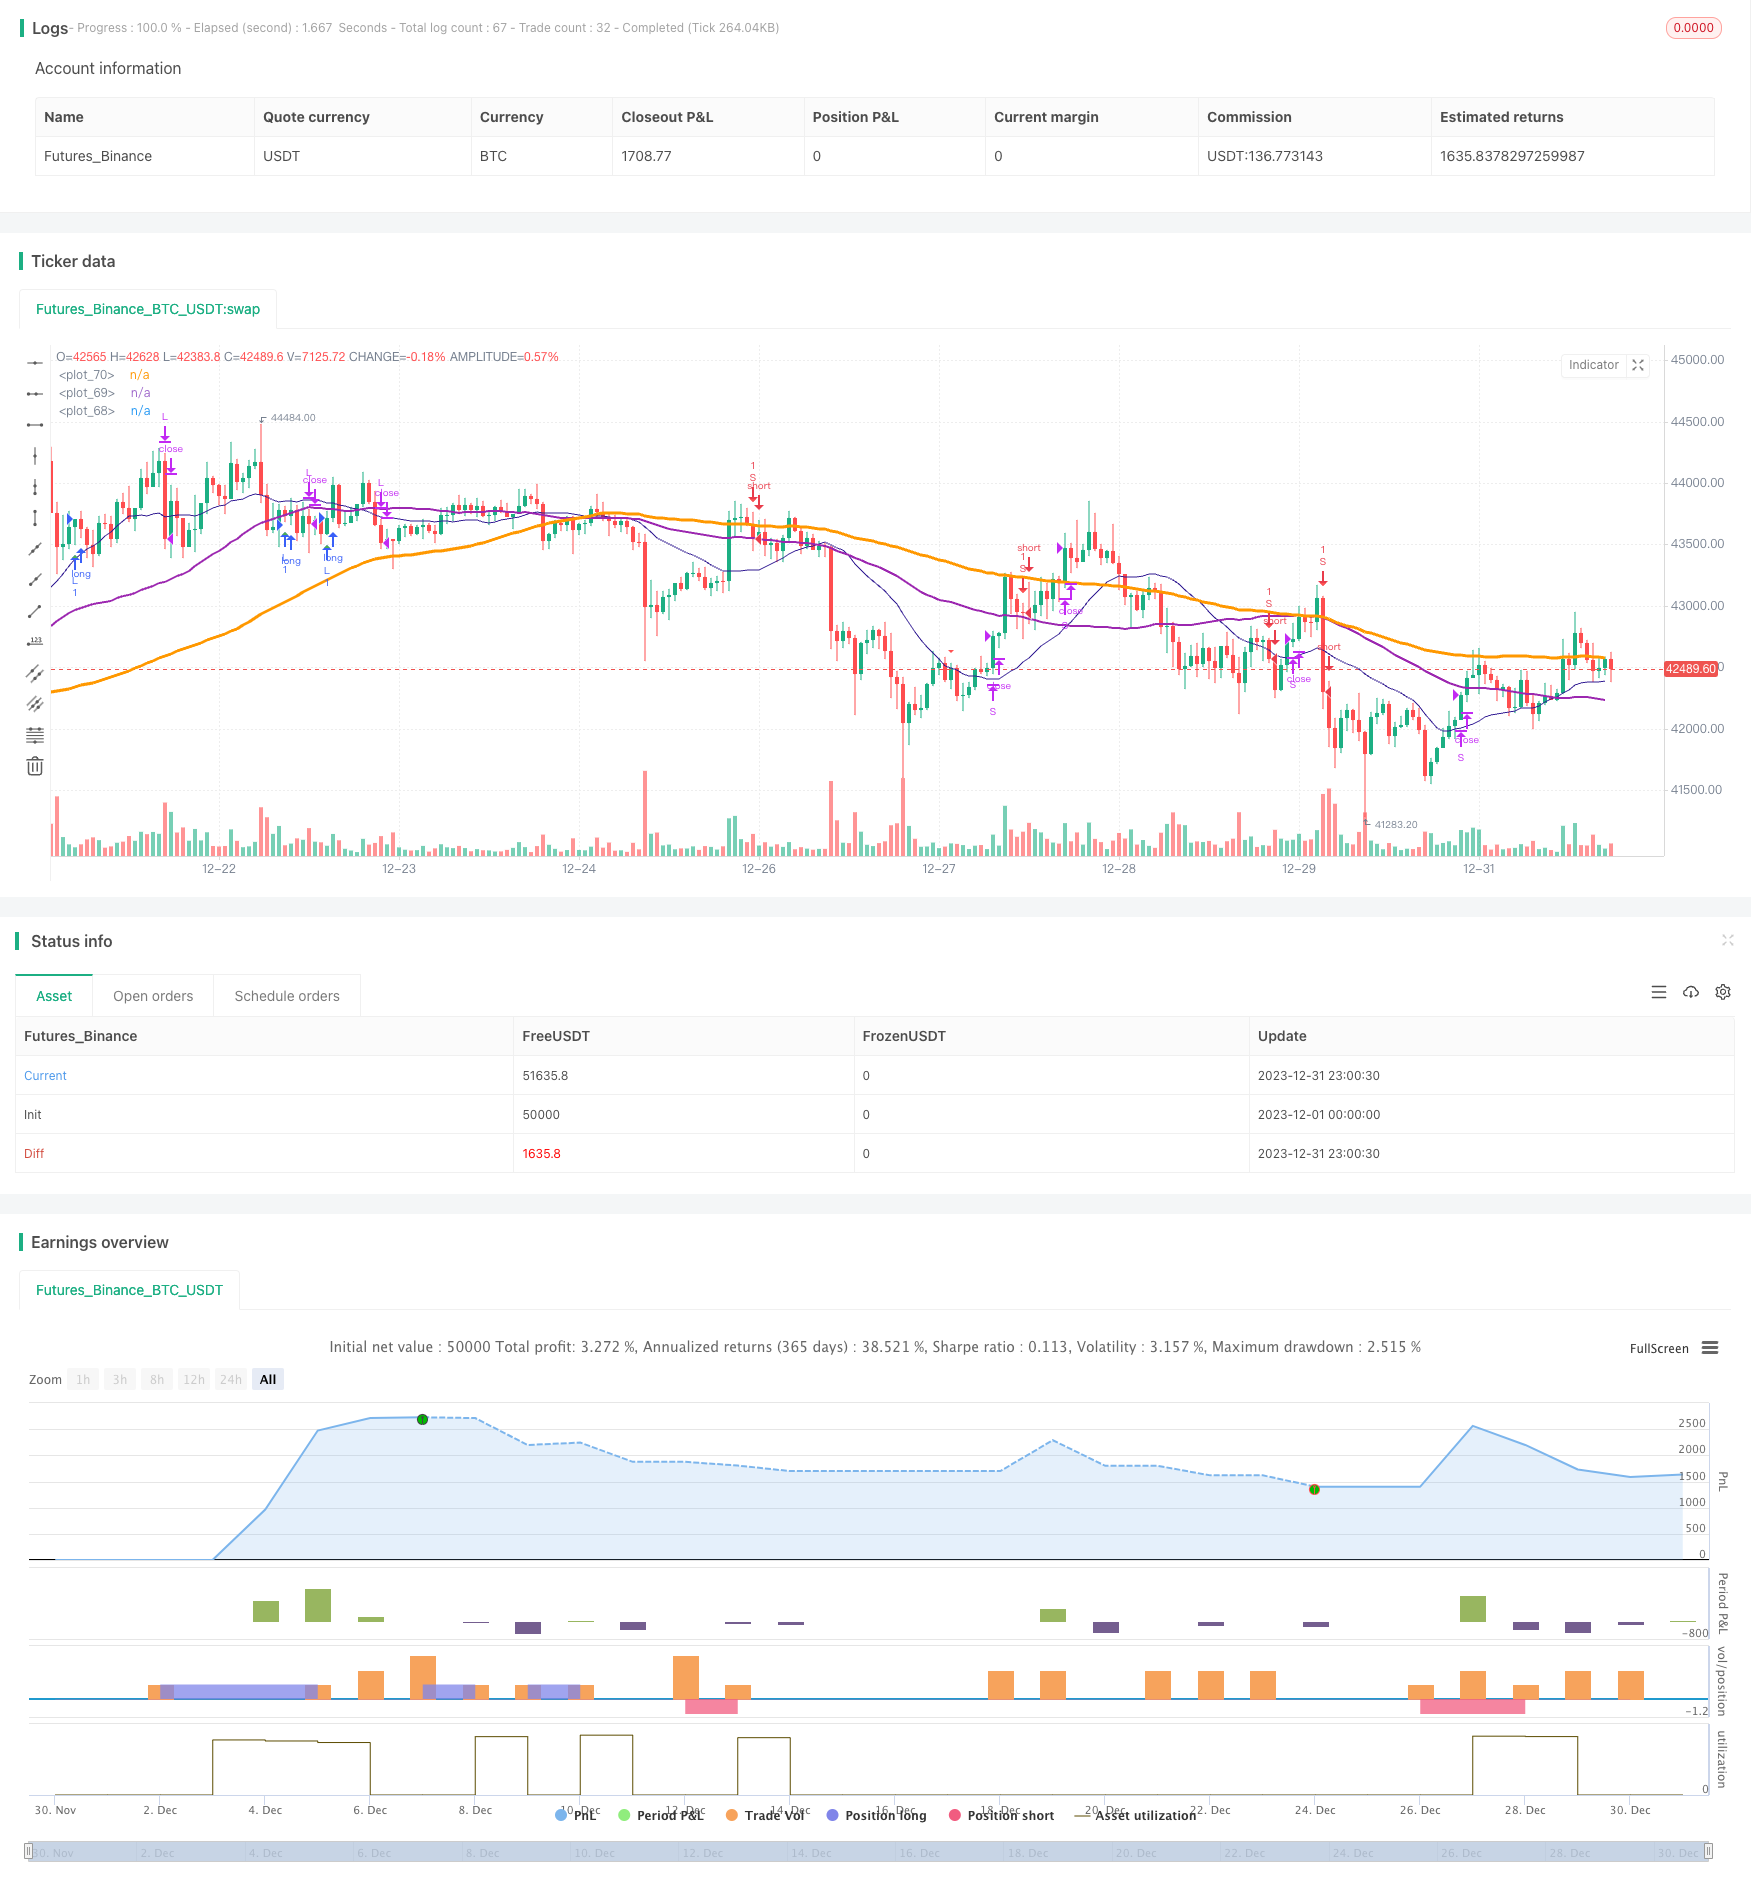
/*backtest
start: 2023-12-01 00:00:00
end: 2023-12-31 23:59:59
period: 1h
basePeriod: 15m
exchanges: [{"eid":"Futures_Binance","currency":"BTC_USDT"}]
*/

//@version=4
//study(title="@sentenzal strategy", shorttitle="@sentenzal strategy", overlay=true)
strategy(title="@sentenzal strategy", shorttitle="@sentenzal strategy", overlay=true  )
smoothK = input(3, minval=1)
smoothD = input(3, minval=1)
lengthRSI = input(14, minval=1)
lengthStoch = input(14, minval=1)
overbought = input(80, minval=1)
oversold = input(20, minval=1)
smaLengh = input(100, minval=1)
smaLengh2 = input(50, minval=1)
smaLengh3 = input(20, minval=1)

src = input(close, title="RSI Source")
testStartYear = input(2017, "Backtest Start Year")
testStartMonth = input(1, "Backtest Start Month")
testStartDay = input(1, "Backtest Start Day")
testPeriodStart = timestamp(testStartYear,testStartMonth,testStartDay,0,0)
testPeriod() =>
    time >= testPeriodStart ? true : false

rsi1 = rsi(src, lengthRSI)
k = sma(stoch(rsi1, rsi1, rsi1, lengthStoch), smoothK)
d = sma(k, smoothD)
crossBuy = crossover(k, d) and k < oversold
crossSell = crossunder(k, d) and k > overbought

dcLower = lowest(low, 10)
dcUpper = highest(high, 10)


heikinashi_close = security(heikinashi(syminfo.tickerid), timeframe.period, close)
heikinashi_open = security(heikinashi(syminfo.tickerid), timeframe.period, open)
heikinashi_low = security(heikinashi(syminfo.tickerid), timeframe.period, low)
heikinashi_high = security(heikinashi(syminfo.tickerid), timeframe.period, high)
heikinashiPositive = heikinashi_close >= heikinashi_open

heikinashiBuy = heikinashiPositive == true and heikinashiPositive[1] == false  and heikinashiPositive[2] == false
heikinashiSell = heikinashiPositive == false and heikinashiPositive[1] == true and heikinashiPositive[2] == true

//plotshape(heikinashiBuy, style=shape.arrowup, color=green, location=location.belowbar, size=size.tiny)
//plotshape(heikinashiSell, style=shape.arrowdown, color=red, location=location.abovebar, size=size.tiny)

buy = (crossBuy == true or crossBuy[1] == true or crossBuy[2] == true) and (heikinashiBuy == true or heikinashiBuy[1] == true or heikinashiBuy[2] == true)
sell = (crossSell == true or crossSell[1] == true or crossSell[2] == true) and (heikinashiSell == true or heikinashiSell[1] == true or heikinashiSell[2] == true)

mult = timeframe.period == '15' ? 4 : 1
mult2 = timeframe.period == '240' ? 0.25 : mult

movingAverage = sma(close, round(smaLengh))
movingAverage2 = sma(close, round(smaLengh2))
movingAverage3 = sma(close, round(smaLengh3))

uptrend = movingAverage < movingAverage2 and movingAverage2 < movingAverage3 and close > movingAverage
downtrend = movingAverage > movingAverage2 and movingAverage2 > movingAverage3 and close < movingAverage

signalBuy = (buy[1] == false and buy[2] == false and buy == true) and uptrend
signalSell = (sell[1] == false and sell[2] == false and sell == true) and downtrend

takeProfitSell = (buy[1] == false and buy[2] == false and buy == true) and uptrend == false
takeProfitBuy = (sell[1] == false and sell[2] == false and sell == true)  and uptrend

plotshape(signalBuy, style=shape.triangleup, color=green, location=location.belowbar, size=size.tiny)
plotshape(signalSell, style=shape.triangledown, color=red, location=location.abovebar, size=size.tiny)


plot(movingAverage, linewidth=3, color=orange, transp=0)
plot(movingAverage2, linewidth=2, color=purple, transp=0)
plot(movingAverage3, linewidth=1, color=navy, transp=0)

alertcondition(signalBuy, title='Signal Buy', message='Signal Buy')
alertcondition(signalSell, title='Signal Sell', message='Signal Sell')


strategy.close("L", when=dcLower[1] > low)
strategy.close("S", when=dcUpper[1] < high)

strategy.entry("L", strategy.long, 1, when = signalBuy and testPeriod() and uptrend)
strategy.entry("S", strategy.short, 1, when = signalSell and testPeriod() and uptrend ==false)

//strategy.exit("Exit Long", from_entry = "L", loss = 25000000, profit=25000000)
//strategy.exit("Exit Short", from_entry = "S", loss = 25000000, profit=25000000)