ダブルリバーサルオシレータートレンドフォロー戦略
概要
双反転振動帯のトレンド追跡戦略は,双反転信号と振動帯の指標を組み合わせてトレンド追跡取引を実現する. それは,まず123反転システムの反転信号を生成し,次にFractal Chaos Bandsの指標のフィルター信号と組み合わせてトレンド追跡を実現する. この戦略は,反転の機会を識別するとともに,トレンドを追跡することができる.
戦略原則
123 反転システム
123反転システムは,Ulf Jensenの”私はどのように期貨市場で3倍の収益を得ることができるか”の183ページの内容に由来する.その取引シグナルは:
閉盘価格が前日の閉盘価格より2日連続で高く,そして9日目のSlow K線が50より低ければ,多額;閉盘価格が前日の閉盘価格より2日連続で低ければ,そして9日目のFast K線が50より高ければ,空白.
この部分は,主にストキャスティックオシレータ指数を使用して,超買い超売り領域で信号を生成します. ストキャスティックオシレータ指数が上昇し続けているが,上昇する余地がまだあるとき,看板戦略を取ります. ストキャスティックオシレータ指数が減少し続けているが,減少する余地がまだあるとき,看板戦略を取ります.
フラクタル・カオス・バンド指数
Fractal Chaos Bands指標は,株価の最高点と最低点を描き,上線と下線を形成して,市場の傾向を判断する.具体的ルールは:
価格が上昇して上線を突破すると,多めに;価格が下がって下線を突破すると,空いてください.
この部分は,主にトレンドフィルターとして,123反転信号と組み合わせて使用されます. 両方の信号が一致した場合のみ,ポジションを開きます.
戦略的優位性
- 逆転とトレンドを組み合わせて チャンスを捉える
双反転の振動帯トレンド追跡戦略は,反転の機会を捉えるだけでなく,トレンドを追跡することもでき,非常に包括的です.市場が振動状態かトレンド状態であるかどうかにかかわらず,取引シグナルを取得できます.
- 偽信号を減らし,勝利率を上げる
単一の指標と比較して,この戦略は,ダブル指標の組み合わせによるフィルタリングにより,偽信号を大幅に削減し,実際の取引の勝率と収益率を向上させることができる.
- パラメータ調整の柔軟性,適応性
双反転振動帯のトレンド追跡戦略のパラメータはよく理解されており,ユーザは自身のニーズと市場環境に応じて調整することができ,非常に柔軟である.振動市であろうとトレンド市であろうと,パラメータによって調整することができる.
リスクと最適化
- 大流行に適応できない
戦略自体は中短線取引の機会に依存している.大きな市場トレンドでは,この戦略は過剰な反転信号を生成し,出場を停止する可能性がある.これはパラメータの調整によって最適化することができる.
- 限界的な資金援助が必要
二重反転振動帯トレンドトラッキング戦略は,頻繁に取引されるタイプであり,ポジション開設保証金の需要をサポートするために十分な限界資金が必要である.資金不足のユーザーの場合,適切なポジションの縮小が必要になる可能性があります.
- 複数の指標のフィルタリングを組み合わせることができます.
この戦略は,既存の基礎の上に,より多くの異なるタイプの指標を導入して,信号源を豊かにし,戦略の安定性を向上させることができる.例えば,反転とトレンドシグナルを検査する量能指標,波動率指標などを追加する.
要約する
二重反転振動帯トレンド追跡戦略は,反転取引とトレンド追跡の優位性を成功裏に組み合わせ,反転を捕捉することも,トレンドを追跡することもでき,非常に包括的で高効率である.単一の指標と比較して,偽信号を大幅に削減し,実際の取引の勝率と利益レベルを向上させることができる.さらに,この戦略のパラメータは柔軟に調整され,ユーザーは自分のスタイルと市場環境に応じて最適化することができます.全体的に,これは非常に優れた量化戦略であり,実験的に検証に値する.
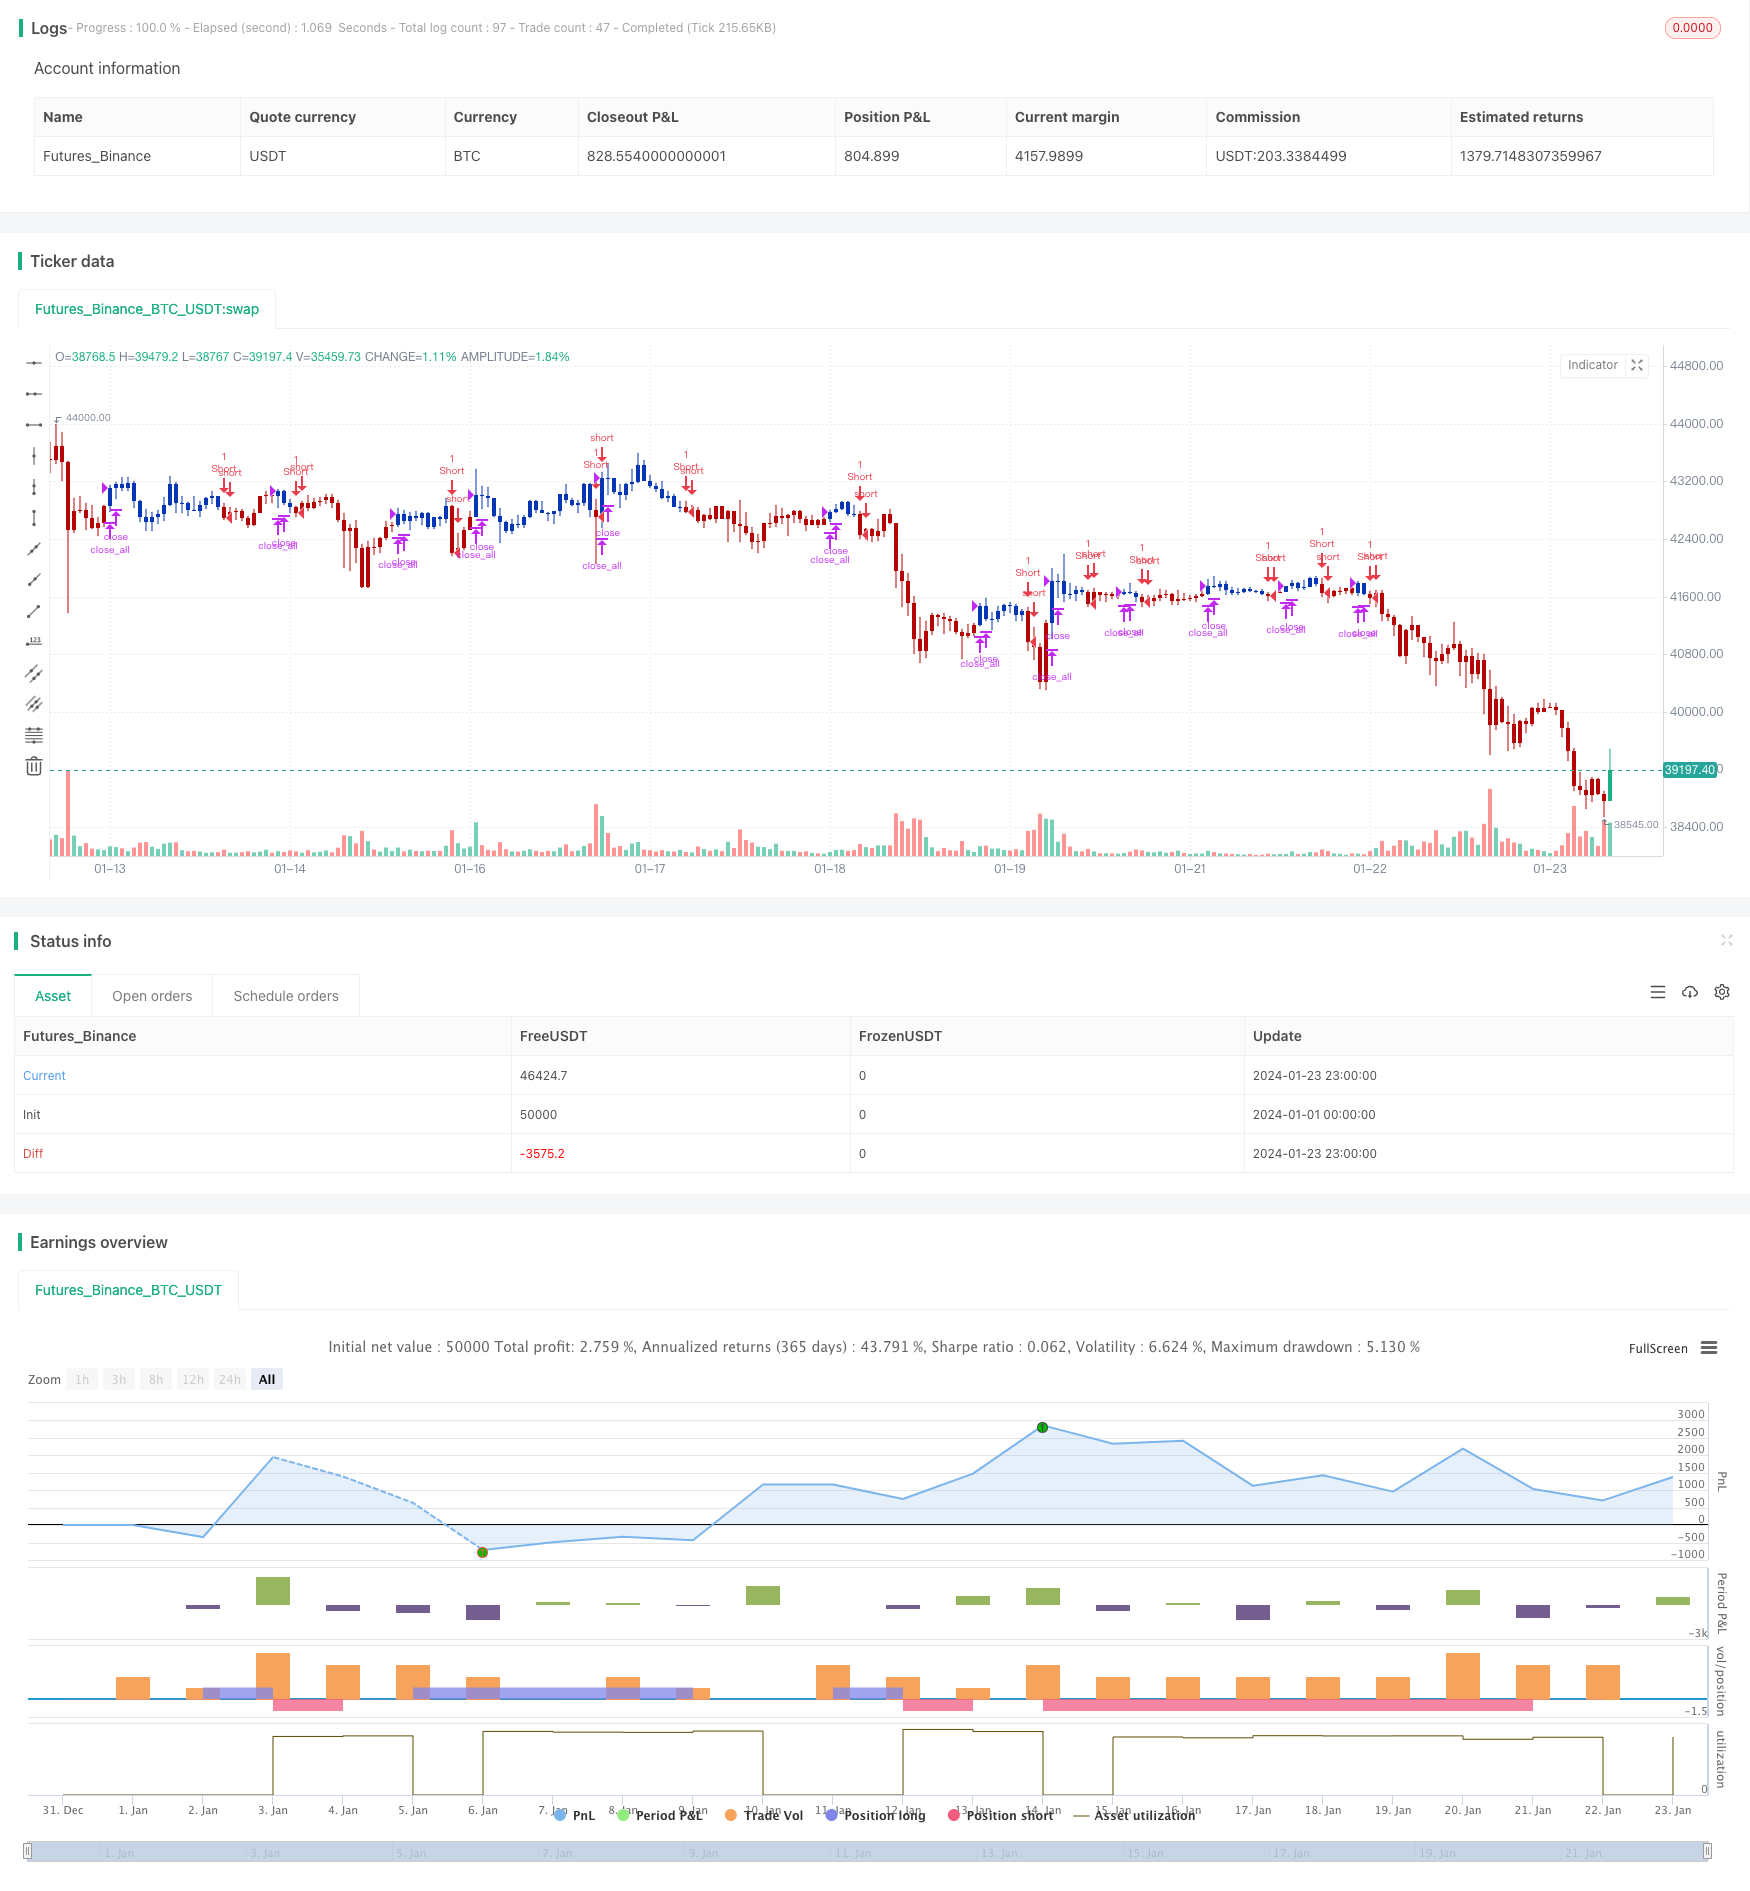
/*backtest
start: 2024-01-01 00:00:00
end: 2024-01-24 00:00:00
period: 1h
basePeriod: 15m
exchanges: [{"eid":"Futures_Binance","currency":"BTC_USDT"}]
*/

//@version=4
////////////////////////////////////////////////////////////
//  Copyright by HPotter v1.0 21/09/2020
// This is combo strategies for get a cumulative signal.
//
// First strategy
// This System was created from the Book "How I Tripled My Money In The
// Futures Market" by Ulf Jensen, Page 183. This is reverse type of strategies.
// The strategy buys at market, if close price is higher than the previous close
// during 2 days and the meaning of 9-days Stochastic Slow Oscillator is lower than 50.
// The strategy sells at market, if close price is lower than the previous close price
// during 2 days and the meaning of 9-days Stochastic Fast Oscillator is higher than 50.
//
// Second strategy
//  Stock market moves in a highly chaotic way, but at a larger scale, the movements
// follow a certain pattern that can be applied to shorter or longer periods of time
// and we can use Fractal Chaos Bands Indicator to identify those patterns. Basically,
// the Fractal Chaos Bands Indicator helps us to identify whether the stock market is
// trending or not. When a market is trending, the bands will have a slope and if market
// is not trending the bands will flatten out. As the slope of the bands decreases, it
// signifies that the market is choppy, insecure and variable. As the graph becomes more
// and more abrupt, be it going up or down, the significance is that the market becomes
// trendy, or stable. Fractal Chaos Bands Indicator is used similarly to other bands-indicator
// (Bollinger bands for instance), offering trading opportunities when price moves above or
// under the fractal lines.
//
// The FCB indicator looks back in time depending on the number of time periods trader selected
// to plot the indicator. The upper fractal line is made by plotting stock price highs and the
// lower fractal line is made by plotting stock price lows. Essentially, the Fractal Chaos Bands
// show an overall panorama of the price movement, as they filter out the insignificant fluctuations
// of the stock price.
//
// WARNING:
// - For purpose educate only
// - This script to change bars colors.
////////////////////////////////////////////////////////////
Reversal123(Length, KSmoothing, DLength, Level) =>
    vFast = sma(stoch(close, high, low, Length), KSmoothing)
    vSlow = sma(vFast, DLength)
    pos = 0.0
    pos := iff(close[2] < close[1] and close > close[1] and vFast < vSlow and vFast > Level, 1,
	         iff(close[2] > close[1] and close < close[1] and vFast > vSlow and vFast < Level, -1, nz(pos[1], 0)))
	pos

fractalUp(pattern) =>
    p = high[pattern+1]
    okl = 1
    okr = 1
    res = 0.0
	for i = pattern to 1
		okl := iff(high[i] < high[i+1] and okl == 1 , 1, 0)
	for i = pattern+2 to pattern*2+1
		okr := iff(high[i] < high[i-1] and okr == 1, 1, 0)
	res := iff(okl == 1 and okr == 1, p, res[1])
    res

fractalDn(pattern) =>
    p = low[pattern+1]
    okl = 1
    okr = 1
    res =0.0
	for i = pattern to 1
		okl := iff(low[i] > low[i+1] and okl == 1 , 1, 0)
	for i = pattern+2 to pattern*2+1
		okr := iff(low[i] > low[i-1] and okr == 1, 1, 0)
	res := iff(okl == 1 and okr == 1, p, res[1])
    res

FCB(Pattern) =>
    pos = 0.0
    xUpper = fractalUp(Pattern)
    xLower = fractalDn(Pattern)
    pos := iff(close > xUpper, 1,
             iff(close < xLower, -1, nz(pos[1], 0)))
    pos

strategy(title="Combo Backtest 123 Reversal & Fractal Chaos Bands", shorttitle="Combo", overlay = true)
Length = input(15, minval=1)
KSmoothing = input(1, minval=1)
DLength = input(3, minval=1)
Level = input(50, minval=1)
//-------------------------
Pattern = input(1, minval=1)
reverse = input(false, title="Trade reverse")
posReversal123 = Reversal123(Length, KSmoothing, DLength, Level)
posFCB = FCB(Pattern)
pos = iff(posReversal123 == 1 and posFCB == 1 , 1,
	   iff(posReversal123 == -1 and posFCB == -1, -1, 0))
possig = iff(reverse and pos == 1, -1,
          iff(reverse and pos == -1 , 1, pos))
if (possig == 1)
    strategy.entry("Long", strategy.long)
if (possig == -1)
    strategy.entry("Short", strategy.short)
if (possig == 0)
    strategy.close_all()
barcolor(possig == -1 ? #b50404: possig == 1 ? #079605 : #0536b3 )