CMO と WMA に基づくデュアル移動平均取引戦略
概要
この戦略は,価格動態指標のChandre動態振動器 ((CMO) とその加重移動平均 ((WMA)) をベースにした二均線取引戦略である.
戦略原則
この戦略はまずCMOを計算し,この指標は価格のオンライン動力の変化を測定する.正値は上昇勢いを表示し,負値は下降勢いを表示する.それからCMOのWMAを計算する.CMOがWMAを上越したとき,看板のポジションを取ります.CMOがWMAを下越したとき,看板のポジションを取ります.この戦略は,CMOとWMAの交差点を利用してトレンドのターニングポイントをキャプチャする.
CMOを計算する際の重要なステップは
- xMomの1日間の価格変動を計算する
- 価格変化のn日SMAを求め,真の価格動力として ((xSMA_mom)
- n日間のnet price change (xMomLength) を計算する
- 標準化するために,SMAで割る.
- 標準化されたnet price changeをm日WMAで求め,CMO ((xWMACMO) を得する.
この戦略の優点は,価格の中期トレンドの転換点を捉えることである.CMOの絶対値の大きさは,価格走行トレンドの強さを反映し,WMAは波偽突破に有利である.
優位分析
この戦略の最大の利点は,CMO指標の絶対値を使って市場の大衆感情を判断し,WMA波によって中期トレンドの転換点を識別することです.単一の移動平均戦略と比較して,より大きな弾力空間を持つ中期トレンドを捉えることができます.
CMOは価格の変化を標準化し,-100から100の範囲にマッピングし,市場の大衆の感情を判断するのに役立ちます.絶対値の大きさは,現在のトレンドの強さを表しています.WMAはCMOに対して追加のフィードバックを行い,偽の信号が多すぎないようにします.
リスク分析
この戦略に伴う主なリスクは以下の通りです.
- CMOとWMAのパラメータが誤って設定され,偽信号が過剰に発生します.
- トレンドの変動に効果的に対処できず,過度の取引頻度と滑り場コストが生じる
- 真の長期トレンドを識別できないため,長期にわたって持っていたら損失のリスクがある
対応する最適化方法は:
- CMOとWMAのパラメータを調整し,最適なパラメータの組み合わせを見つける
- 取引量エネルギー指数などの追加フィルタリング条件を追加し,波動的な状況での取引を避ける
- 90日線のようなより長い周期の指標を組み合わせて,長線トレンドの機会を逃さないようにします.
最適化の方向
この戦略の最適化方向は,パラメータ最適化,信号フィルタリング,およびストップ・ローズに焦点を当てている.
CMOとWMAのパラメータ最適化:最適のパラメータ組み合わせを検索する
取引量,強弱指標などの補助指標を組み合わせてシグナルフィルタリングを行い,偽ブレイクを回避します.
CMOとWMAの価格が再び下落したときに,ダイナミックな止損メカニズムを追加する
ブレイクアウト・フェイラーパターンは,CMOとWMAが最初にピークを突破し,すぐに再び下落する状況として,入場信号として考えることができます.
逆転取引を避けるために,より長い周期指標を組み合わせて大きなトレンドを判断できます.
要約する
この戦略は,全体として,トレンドの強さと転換点を判断するCMO指標を採用し,WMAと組み合わせて波を生成する取引信号を発生させ,典型的な二均線システムに属している.単一のMA戦略と比較して,より強い弾力性の捕獲の中間トレンドの優位性を持っている.しかし,パラメータ設定と波に関して,適切な取引頻度を制御し,ダイナミックストップを導入し,システムの安定性をさらに向上させるための最適化の余地がある.
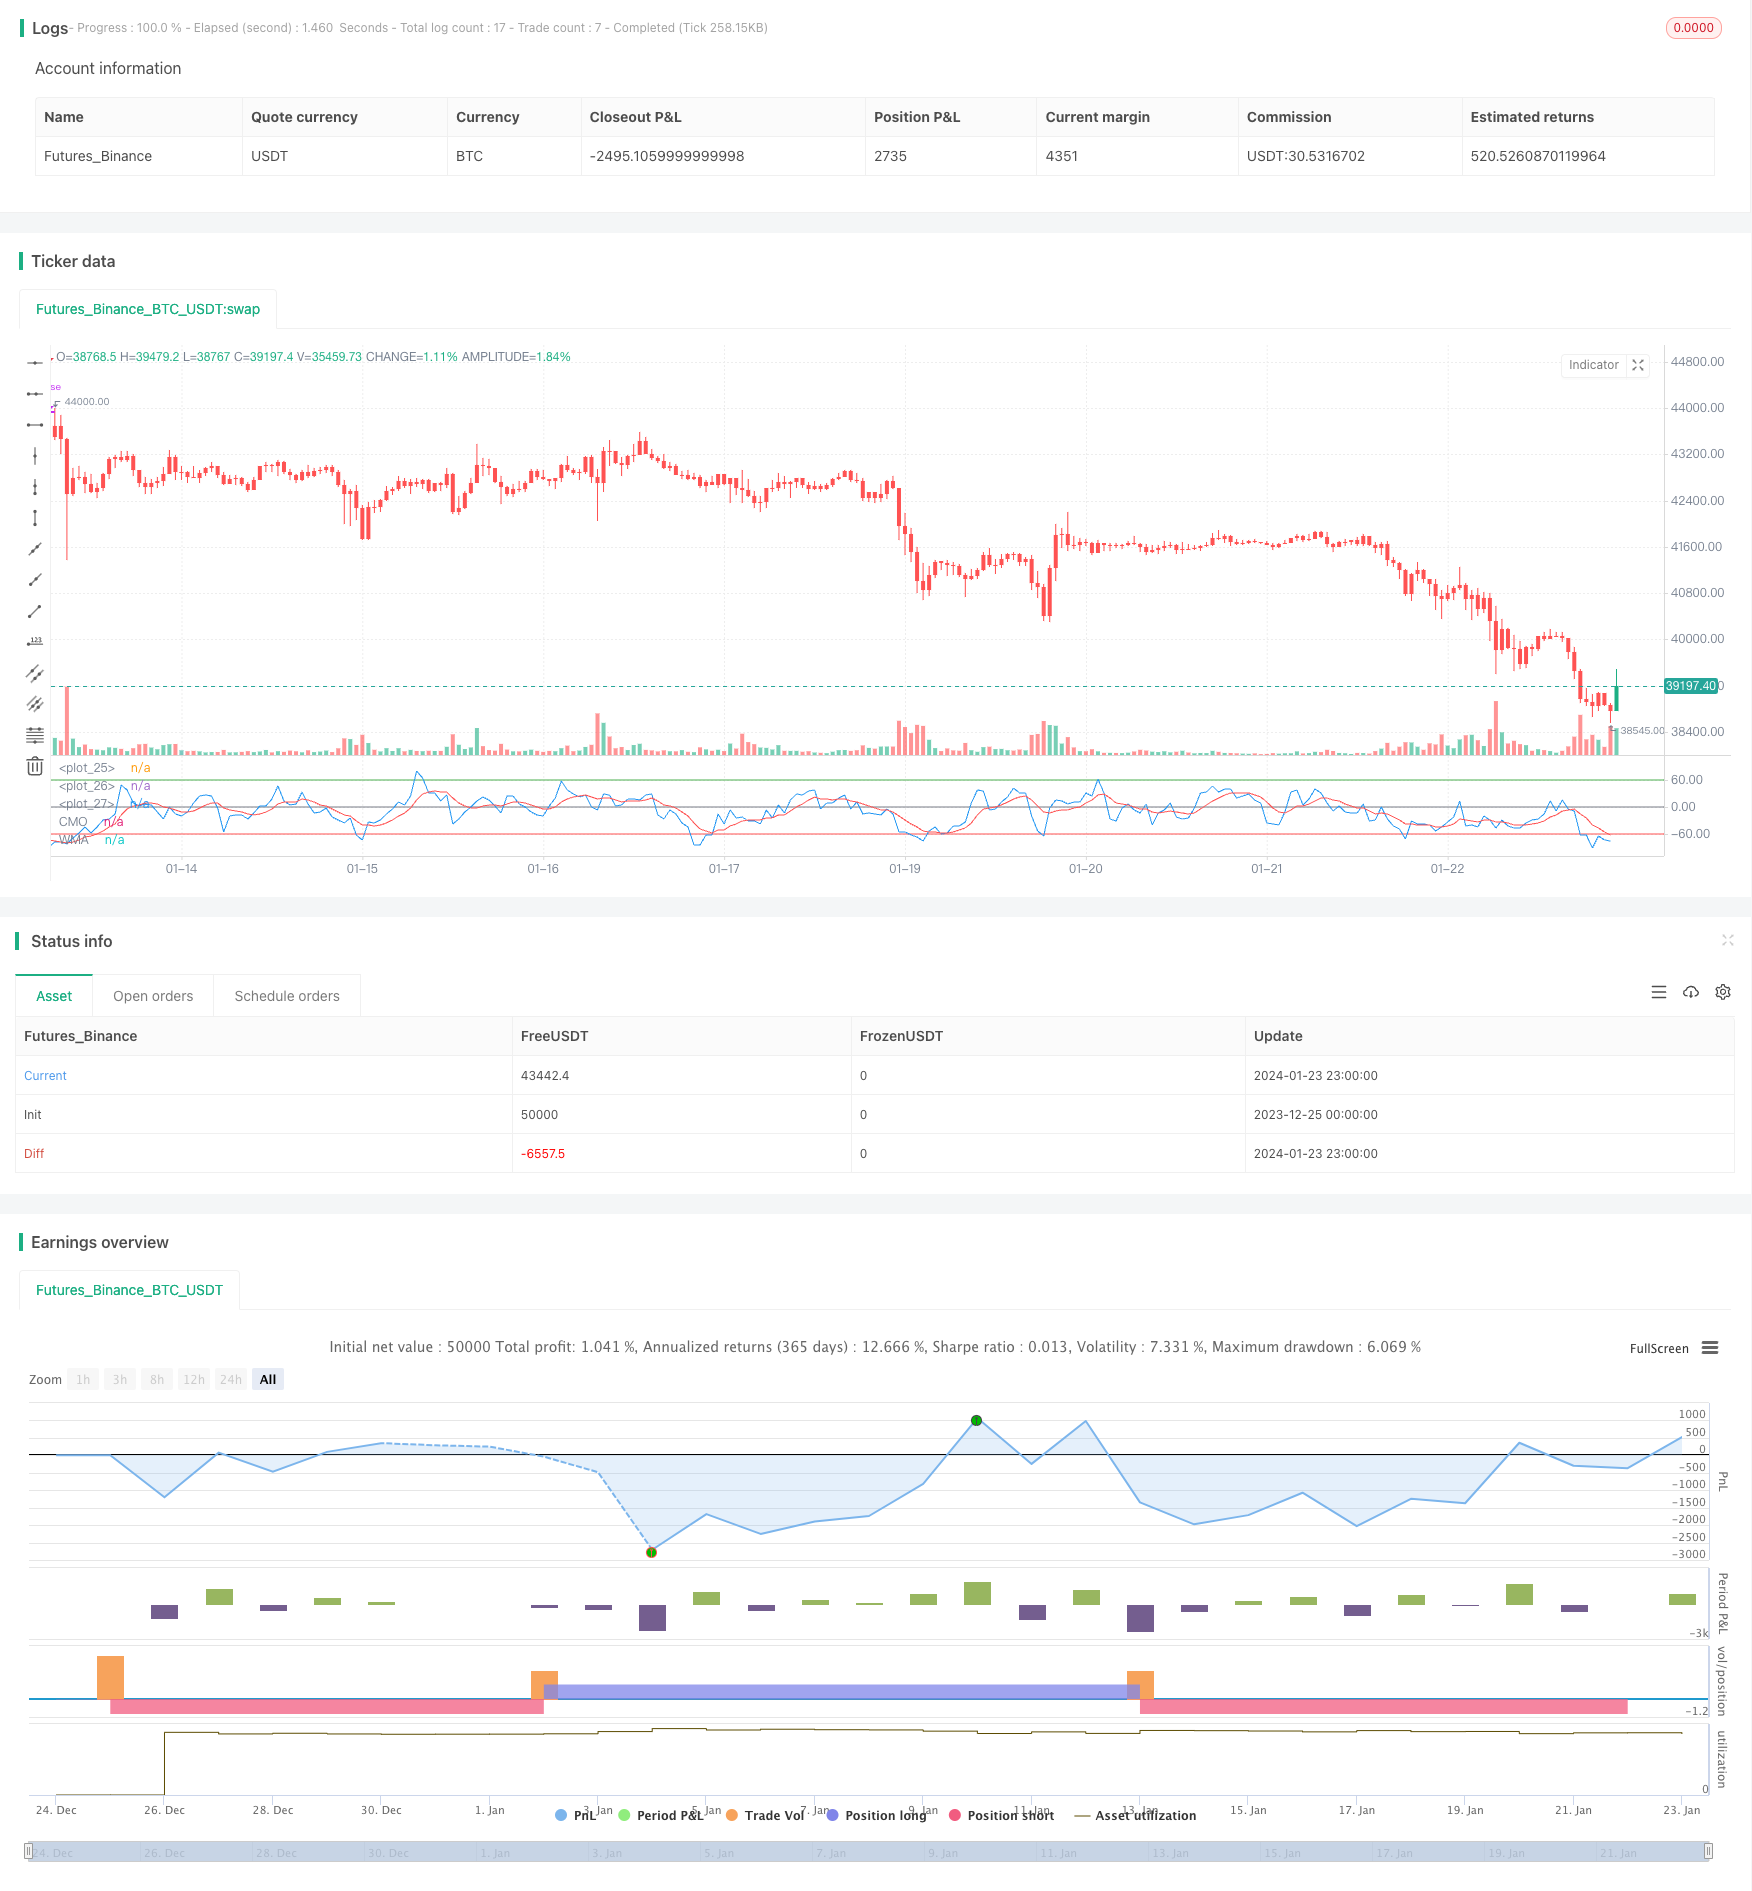
/*backtest
start: 2023-12-25 00:00:00
end: 2024-01-24 00:00:00
period: 1h
basePeriod: 15m
exchanges: [{"eid":"Futures_Binance","currency":"BTC_USDT"}]
*/

//@version=3
////////////////////////////////////////////////////////////
//  Copyright by HPotter v1.0 18/10/2018
//    This indicator plots Chandre Momentum Oscillator and its WMA on the
//    same chart. This indicator plots the absolute value of CMO.
//    The CMO is closely related to, yet unique from, other momentum oriented
//    indicators such as Relative Strength Index, Stochastic, Rate-of-Change,
//    etc. It is most closely related to Welles Wilder?s RSI, yet it differs
//    in several ways:
//    - It uses data for both up days and down days in the numerator, thereby
//        directly measuring momentum;
//    - The calculations are applied on unsmoothed data. Therefore, short-term
//        extreme movements in price are not hidden. Once calculated, smoothing
//        can be applied to the CMO, if desired;
//    - The scale is bounded between +100 and -100, thereby allowing you to clearly
//        see changes in net momentum using the 0 level. The bounded scale also allows
//        you to conveniently compare values across different securities.
////////////////////////////////////////////////////////////
strategy(title="CMO & WMA Backtest ver 2.0", shorttitle="CMO & WMA")
Length = input(9, minval=1)
LengthWMA = input(9, minval=1)
BuyZone = input(60, step = 0.01)
SellZone = input(-60, step = 0.01)
reverse = input(false, title="Trade reverse")
hline(BuyZone, color=green, linestyle=line)
hline(SellZone, color=red, linestyle=line)
hline(0, color=gray, linestyle=line)
xMom = abs(close - close[1])
xSMA_mom = sma(xMom, Length)
xMomLength = close - close[Length]
nRes = 100 * (xMomLength / (xSMA_mom * Length))
xWMACMO = wma(nRes, LengthWMA)
pos = 0.0
pos := iff(xWMACMO > BuyZone, 1,
	   iff(xWMACMO < SellZone, -1, nz(pos[1], 0)))
possig = iff(reverse and pos == 1, -1,
          iff(reverse and pos == -1, 1, pos))
if (possig == 1)
    strategy.entry("Long", strategy.long)
if (possig == -1)
    strategy.entry("Short", strategy.short)
barcolor(possig == -1 ? red: possig == 1 ? green : blue )
plot(nRes, color=blue, title="CMO")
plot(xWMACMO, color=red, title="WMA")