ダブルベースインジケーターフォロー戦略
概要
二基指標フォロー戦略は,デジタル通貨の量化取引戦略である.この戦略は,123反転指標とQstick指標の2基指標のシグナルを組み合わせて取引シグナルを生成し,両指標の一致性に基づいて入場を決定する.
戦略原則
この戦略は2つの部分から構成されています.
- 123 逆転指数
この指標の取引シグナルは,最後の2つのK線の閉盘価格から発生する.最後の2つのK線の閉盘価格が逆転する (つまり,閉盘価格が上昇から下落に,または下落から上昇に),同時にもランダムな指標の条件を満たす場合,取引シグナルが生じる.
具体的には,前2日の閉盘価格が下がれば,今日閉盘価格が上がり,同時に9日のランダムなスローラインが50を下回ると,買入シグナルが生じます.前2日の閉盘価格が上がれば,今日閉盘価格が下がり,同時に9日のランダムな快線が50上回ると,売り出札シグナルが生じます.
- Qstickの指標
この指標は,開場価格と閉場価格の差値の単純な移動平均を計算することによって,多頭と空頭の力を判断する. ゼロ軸を通過して取引信号を生成する.
Qstickが0軸を上を通過すると,多頭力の増加を示し,買入シグナルを生成する.Qstickが0軸を下を通過すると,空頭力の増加を示し,売出シグナルを生成する.
双基指標は123反転指数とQstick指数の取引信号を総合的に考慮し,両方の信号が一致すると,対応する取引行動を起こす戦略に従います.
優位分析
双基指標は,2種類の指標を組み合わせる戦略に従っており,取引信号の正確性を向上させることができる.単一の指標と比較して,誤信号を効果的に軽減し,より高い勝利率を得ることができる.
さらに,この戦略は,二つの指標信号が一致するときにのみ導入され,リスクを効果的に制御し,二基差異を防止します.
リスクと解決策
- 指数信号の生成時間は異なっており,完璧に配合できません.
パラメータの最適化により,2つの指標のパラメータを調整して,その信号の発生周波数とリズムをより協調させることができる.
- 2基の差異は超短線に繋がる
最低保有期間の設定は,委託の撤回や委託の設立を頻繁に防ぐことができます.
最適化の方向
2つの指標の長さのパラメータを最適化して,最適なパラメータの組み合わせを見つける
異なるランダムな指標パラメータ配置をテストする
ストップ・ロスの策略に加入
要約する
双基指標は,複数の基指標を組み合わせて戦略の優位性を追うことで,信号の質を向上させ,リスクをコントロールしながら,より高い収益を得ることができる.この戦略には,さらなるパラメータ最適化と戦略最適化のための余地があり,テストによって戦略をより安定して信頼性のあるものにすることができる.
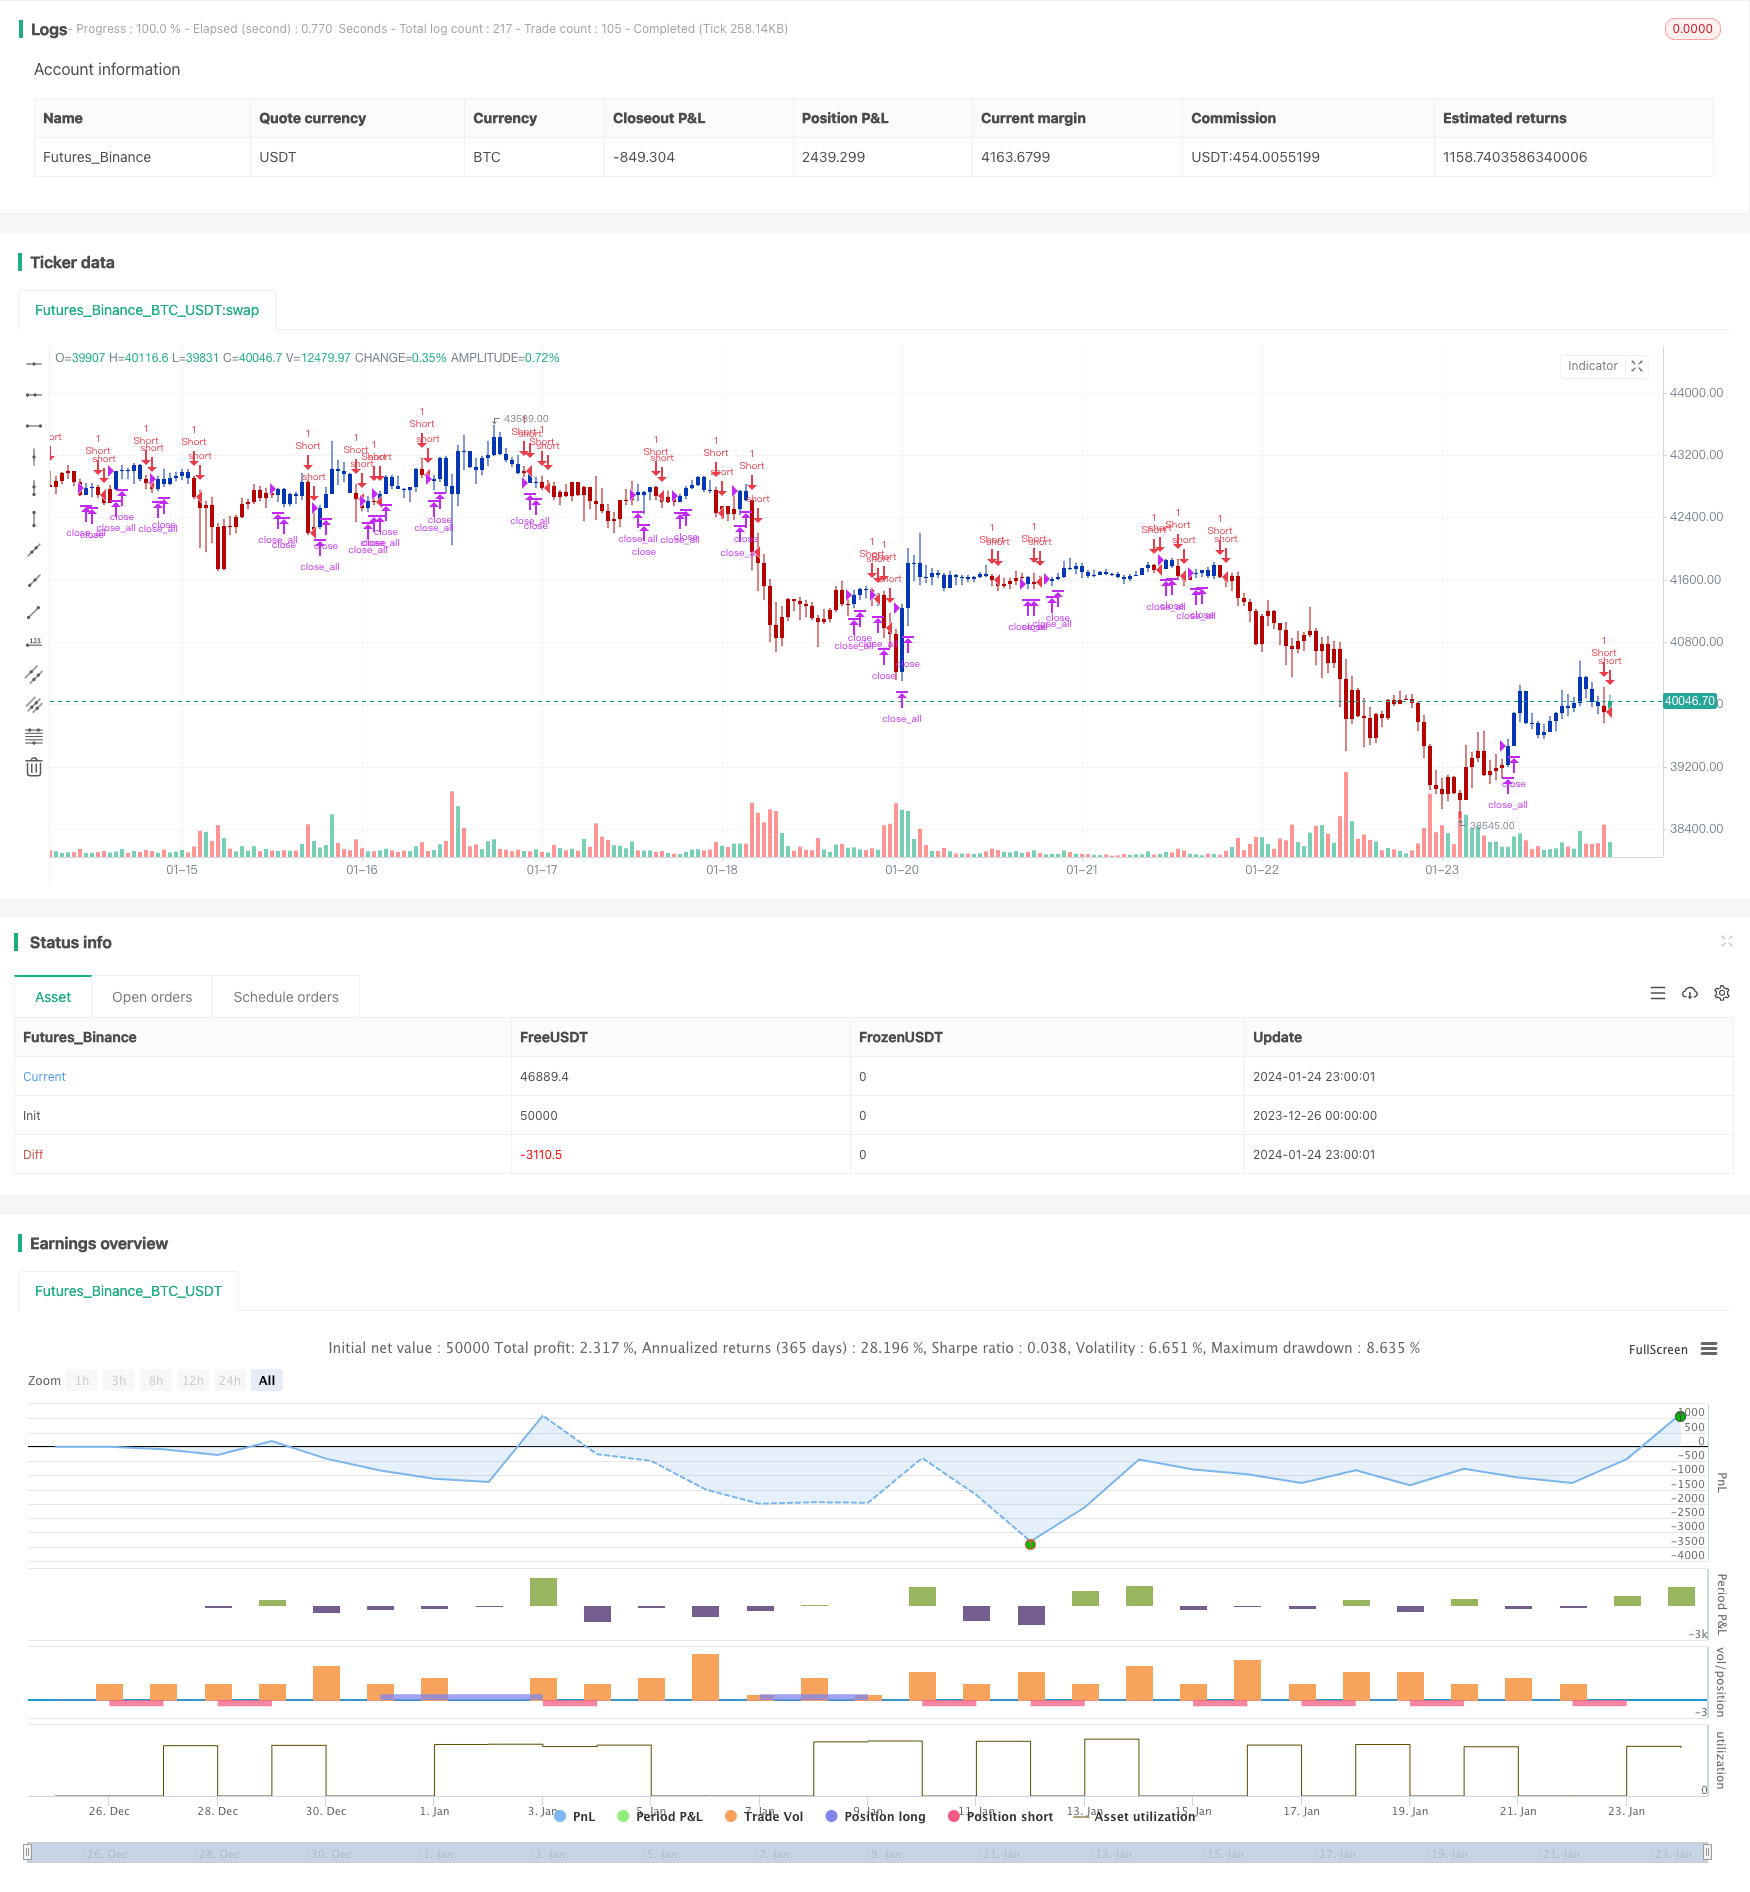
/*backtest
start: 2023-12-26 00:00:00
end: 2024-01-25 00:00:00
period: 1h
basePeriod: 15m
exchanges: [{"eid":"Futures_Binance","currency":"BTC_USDT"}]
*/

//@version=4
////////////////////////////////////////////////////////////
//  Copyright by HPotter v1.0 24/05/2021
// This is combo strategies for get a cumulative signal.
//
// First strategy
// This System was created from the Book "How I Tripled My Money In The
// Futures Market" by Ulf Jensen, Page 183. This is reverse type of strategies.
// The strategy buys at market, if close price is higher than the previous close
// during 2 days and the meaning of 9-days Stochastic Slow Oscillator is lower than 50.
// The strategy sells at market, if close price is lower than the previous close price
// during 2 days and the meaning of 9-days Stochastic Fast Oscillator is higher than 50.
//
// Second strategy
// A technical indicator developed by Tushar Chande to numerically identify
// trends in candlestick charting. It is calculated by taking an 'n' period
// moving average of the difference between the open and closing prices. A
// Qstick value greater than zero means that the majority of the last 'n' days
// have been up, indicating that buying pressure has been increasing.
// Transaction signals come from when the Qstick indicator crosses through the
// zero line. Crossing above zero is used as the entry signal because it is indicating
// that buying pressure is increasing, while sell signals come from the indicator
// crossing down through zero. In addition, an 'n' period moving average of the Qstick
// values can be drawn to act as a signal line. Transaction signals are then generated
// when the Qstick value crosses through the trigger line.
//
// WARNING:
// - For purpose educate only
// - This script to change bars colors.
////////////////////////////////////////////////////////////
Reversal123(Length, KSmoothing, DLength, Level) =>
    vFast = sma(stoch(close, high, low, Length), KSmoothing)
    vSlow = sma(vFast, DLength)
    pos = 0.0
    pos := iff(close[2] < close[1] and close > close[1] and vFast < vSlow and vFast > Level, 1,
	         iff(close[2] > close[1] and close < close[1] and vFast > vSlow and vFast < Level, -1, nz(pos[1], 0)))
	pos


Qstick(Length) =>
    pos = 0.0
    xR = close - open
    xQstick = sma(xR, Length)
    pos:= iff(xQstick > 0, 1,
           iff(xQstick < 0, -1, nz(pos[1], 0)))
    pos

strategy(title="Combo Backtest 123 Reversal & Qstick Indicator", shorttitle="Combo", overlay = true)
line1 = input(true, "---- 123 Reversal ----")
Length = input(14, minval=1)
KSmoothing = input(1, minval=1)
DLength = input(3, minval=1)
Level = input(50, minval=1)
//-------------------------
line2 = input(true, "---- Qstick Indicator ----")
LengthQ = input(14, minval=1)
reverse = input(false, title="Trade reverse")
posReversal123 = Reversal123(Length, KSmoothing, DLength, Level)
posQstick = Qstick(LengthQ)
pos = iff(posReversal123 == 1 and posQstick == 1 , 1,
	   iff(posReversal123 == -1 and posQstick == -1, -1, 0))
possig = iff(reverse and pos == 1, -1,
          iff(reverse and pos == -1 , 1, pos))
if (possig == 1 )
    strategy.entry("Long", strategy.long)
if (possig == -1 )
    strategy.entry("Short", strategy.short)
if (possig == 0)
    strategy.close_all()
barcolor(possig == -1 ? #b50404: possig == 1 ? #079605 : #0536b3 )