移動平均チャネルブレイクアウト戦略
作成日:
2024-01-29 10:26:25
最終変更日:
2024-01-29 10:26:25
コピー:
0
クリック数:
810
1
フォロー
1751
フォロワー
概要
この戦略は,Keltner通路の中軌,上軌,下軌を計算し,中軌をベースに, ABOVE 中軌と下軌を填色する.通路の方向を判断した後に,突破買い取引を行う. トレンド追跡戦略の一種である.
戦略原則
核心指標は,ケルトナー・チャネルである。チャネル中軌は,典型的な価格である ((最高価格+最低価格+閉盘価格) / 3のN日重引移動平均である。チャネル上軌と下軌は,それぞれ中軌から1つの取引範囲のN日重引移動平均である。その中,取引範囲は,実際の波幅ATRを選択することも,振幅を直接採用することもできる。この戦略は後者を採用する。
具体的には,戦略は主に価格が上線または下線を突破するかどうかを判断し,中線を分岐点として多頭または空頭意思決定を行う. 閉盘価格が上線より大きい場合は,多行; 閉盘価格が下線より小さい場合は,空行. 止損線は中線MA値である.
優位分析
- ケルトナー・チャネル指数を使用すると,価格変動の範囲をよく判断し,偽突破を避ける.
- 中軌道均線を支柱として採用することで,損失を減らすことができる.
- 上線を突破し,多下線を空調にするのは,トレンドフォロー戦略であり,ほとんどの株式の価格変化の法則に合致する.
リスク分析
- 突破チャネル戦略はパラメータに敏感であり,最適なパラメータの組み合わせを見つけるために繰り返しテストする必要があります.
- 株価が短期間で大きく変動すると取引リスクが増加する.誤取引のリスクを減らすために,適切なチャネル幅を緩めることができます.
- 効果はパラメータ設定と品種に大きく関連しており,異なる品種に適応する必要がある.
最適化の方向
- 他の指標のフィルター信号と組み合わせて,誤取引を避ける.例えば,量能指標,波動率指標など.
- パラメータを最適化し,最適なパラメータの組み合わせを探します. 主に平均パラメータと通路倍数を調整します.
- 種別パラメータの設定は大きく異なるため,分類最適化が必要である.
要約する
この戦略は,全体的に比較して簡潔で直接的な,一般的な価格突破戦略の一種である. 思想が明確で,容易に理解し,初心者の学習に適している. しかし,一定の制限があり,パラメータに敏感で,効果パラメータが不均一で,繰り返しテスト・最適化が必要である. 他のより複雑な判断指標と組み合わせることができれば,より強力な取引戦略を形成することができる.
ストラテジーソースコード
/*backtest
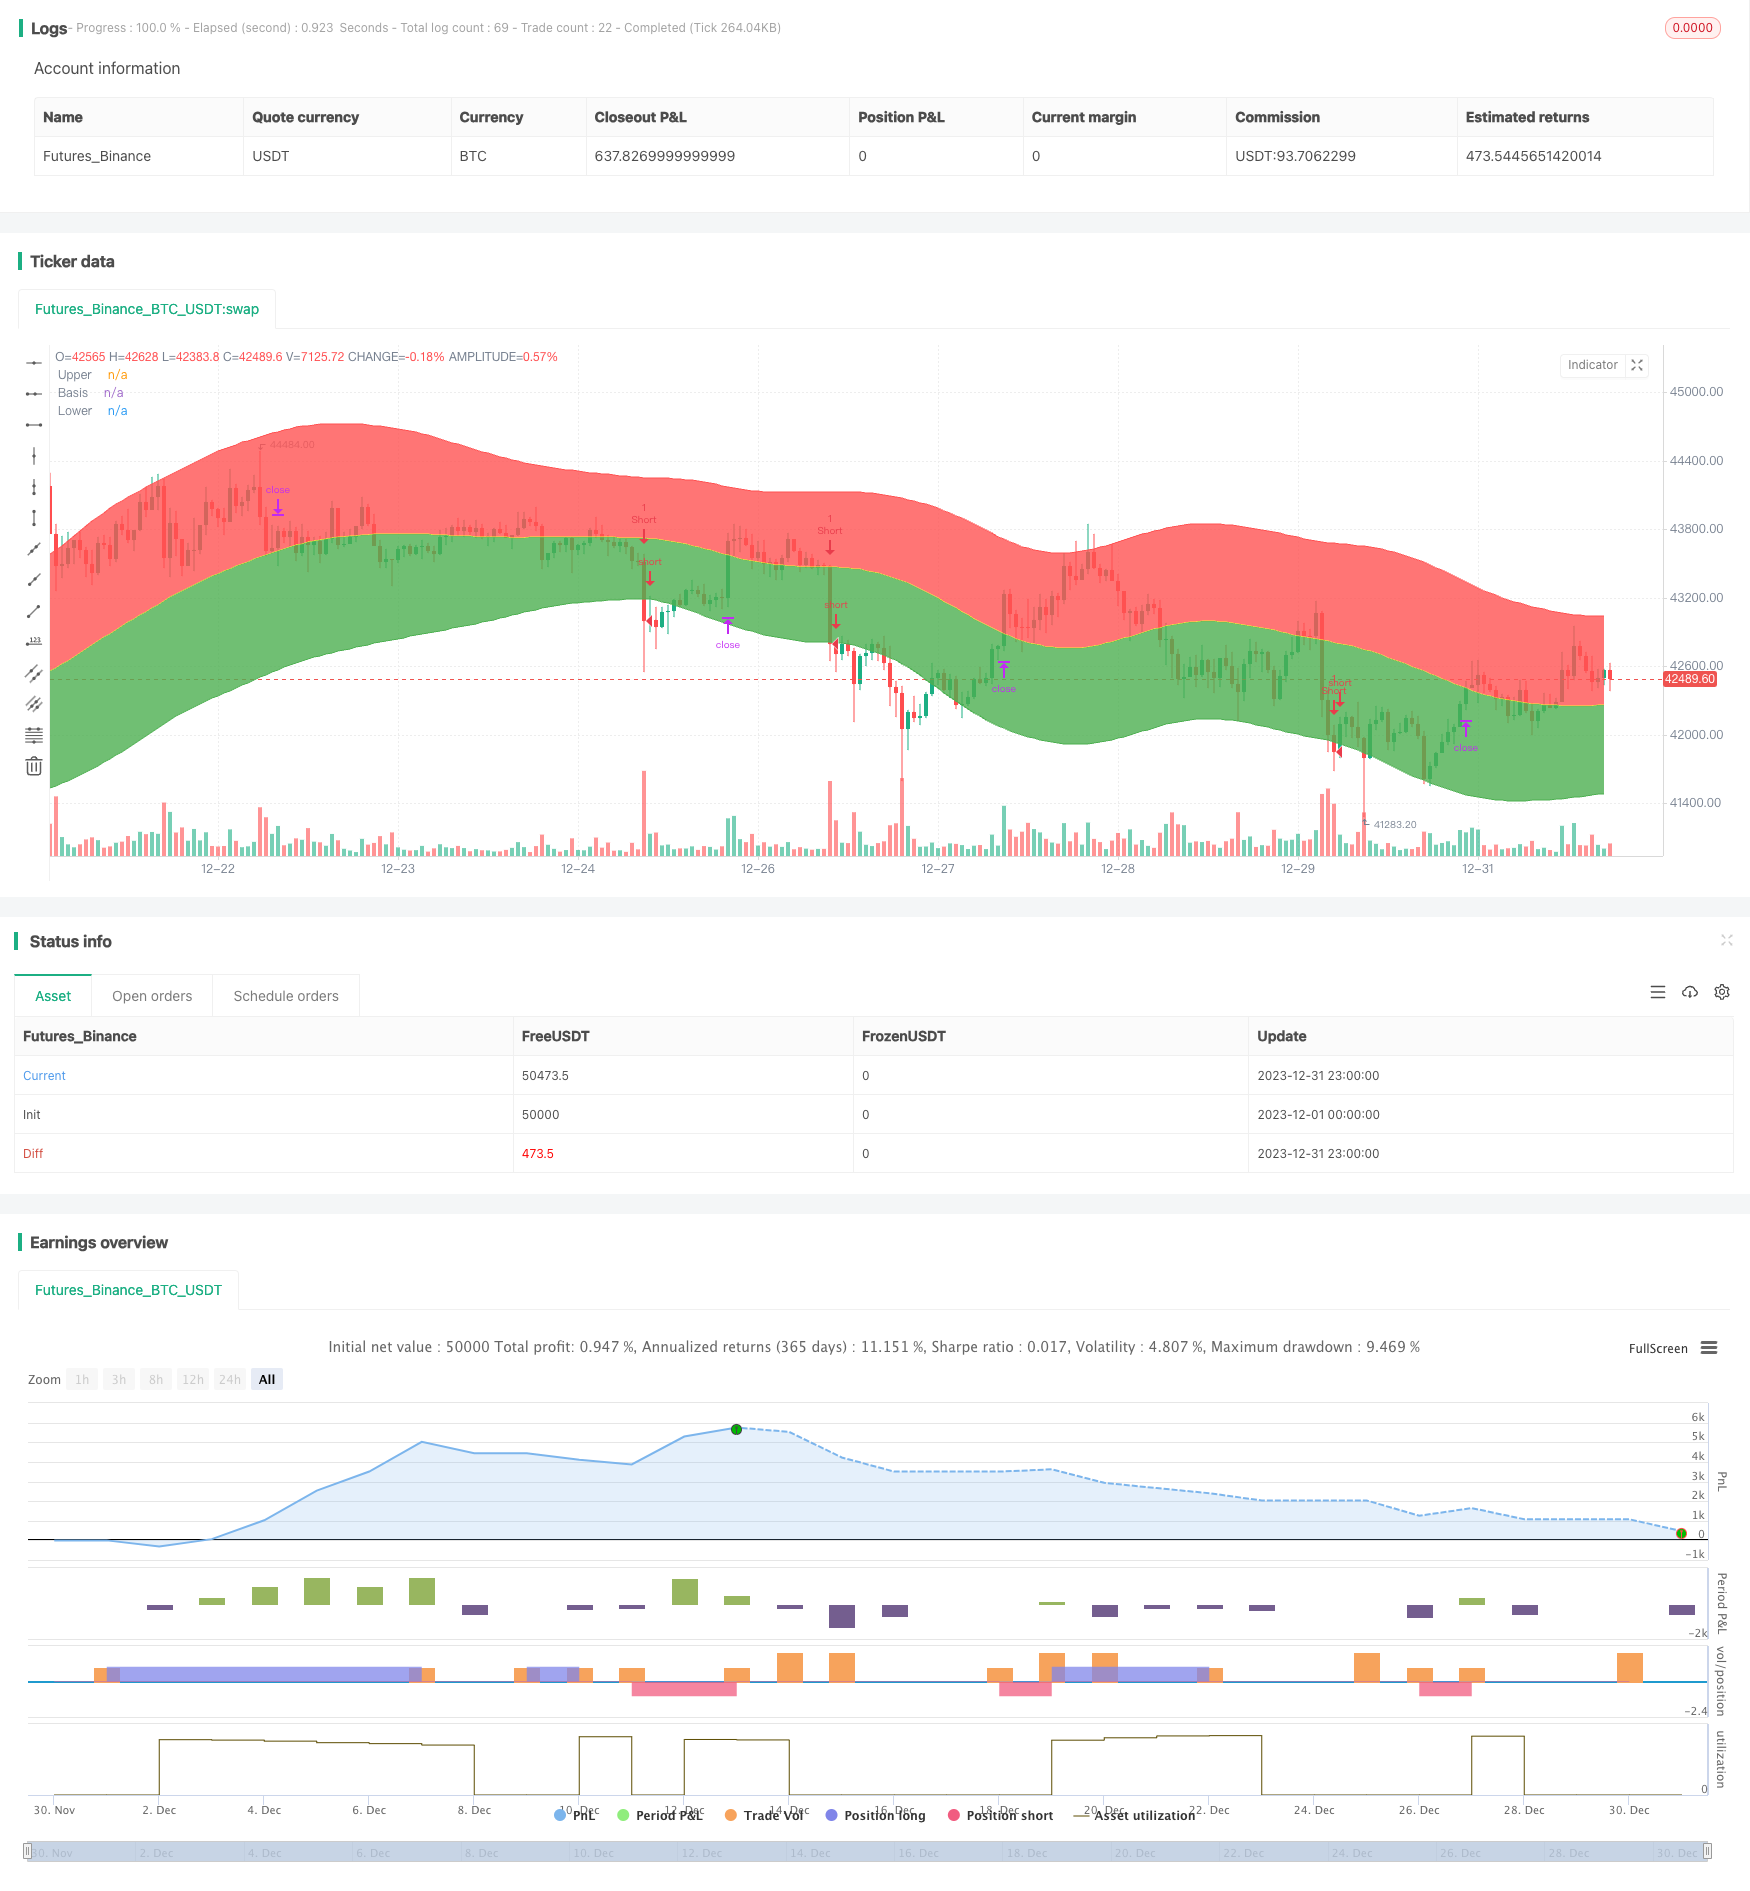
start: 2023-12-01 00:00:00
end: 2023-12-31 23:59:59
period: 1h
basePeriod: 15m
exchanges: [{"eid":"Futures_Binance","currency":"BTC_USDT"}]
*/
// This source code is subject to the terms of the Mozilla Public License 2.0 at https://mozilla.org/MPL/2.0/
// © WMX_Q_System_Trading
//@version=3
strategy(title = "WMX Keltner Channels strategy", shorttitle = "WMX Keltner Channels strategy", overlay = true)
useTrueRange = input(true)
length = input(20, minval=5)
mult = input(2.618, minval=0.1)
mah =ema(ema( ema(high, length),length),length)
mal =ema(ema( ema(low, length),length),length)
range = useTrueRange ? tr : high - low
rangema =ema(ema( ema(range, length),length),length)
upper = mah + rangema * mult
lower = mal - rangema * mult
ma=(upper+lower)/2
uc = red
lc=green
u = plot(upper, color=uc, title="Upper")
basis=plot(ma, color=yellow, title="Basis")
l = plot(lower, color=lc, title="Lower")
fill(u, basis, color=uc, transp=95)
fill(l, basis, color=lc, transp=95)
strategy.entry("Long", strategy.long, stop = upper, when = strategy.position_size <= 0 and close >upper)
strategy.entry("Short", strategy.short, stop = lower, when = strategy.position_size >= 0 and close<lower)
if strategy.position_size > 0
strategy.exit("Stop Long", "Long", stop = ma)
if strategy.position_size < 0
strategy.exit("Stop Short", "Short", stop = ma)