Pシグナル反転戦略
概要
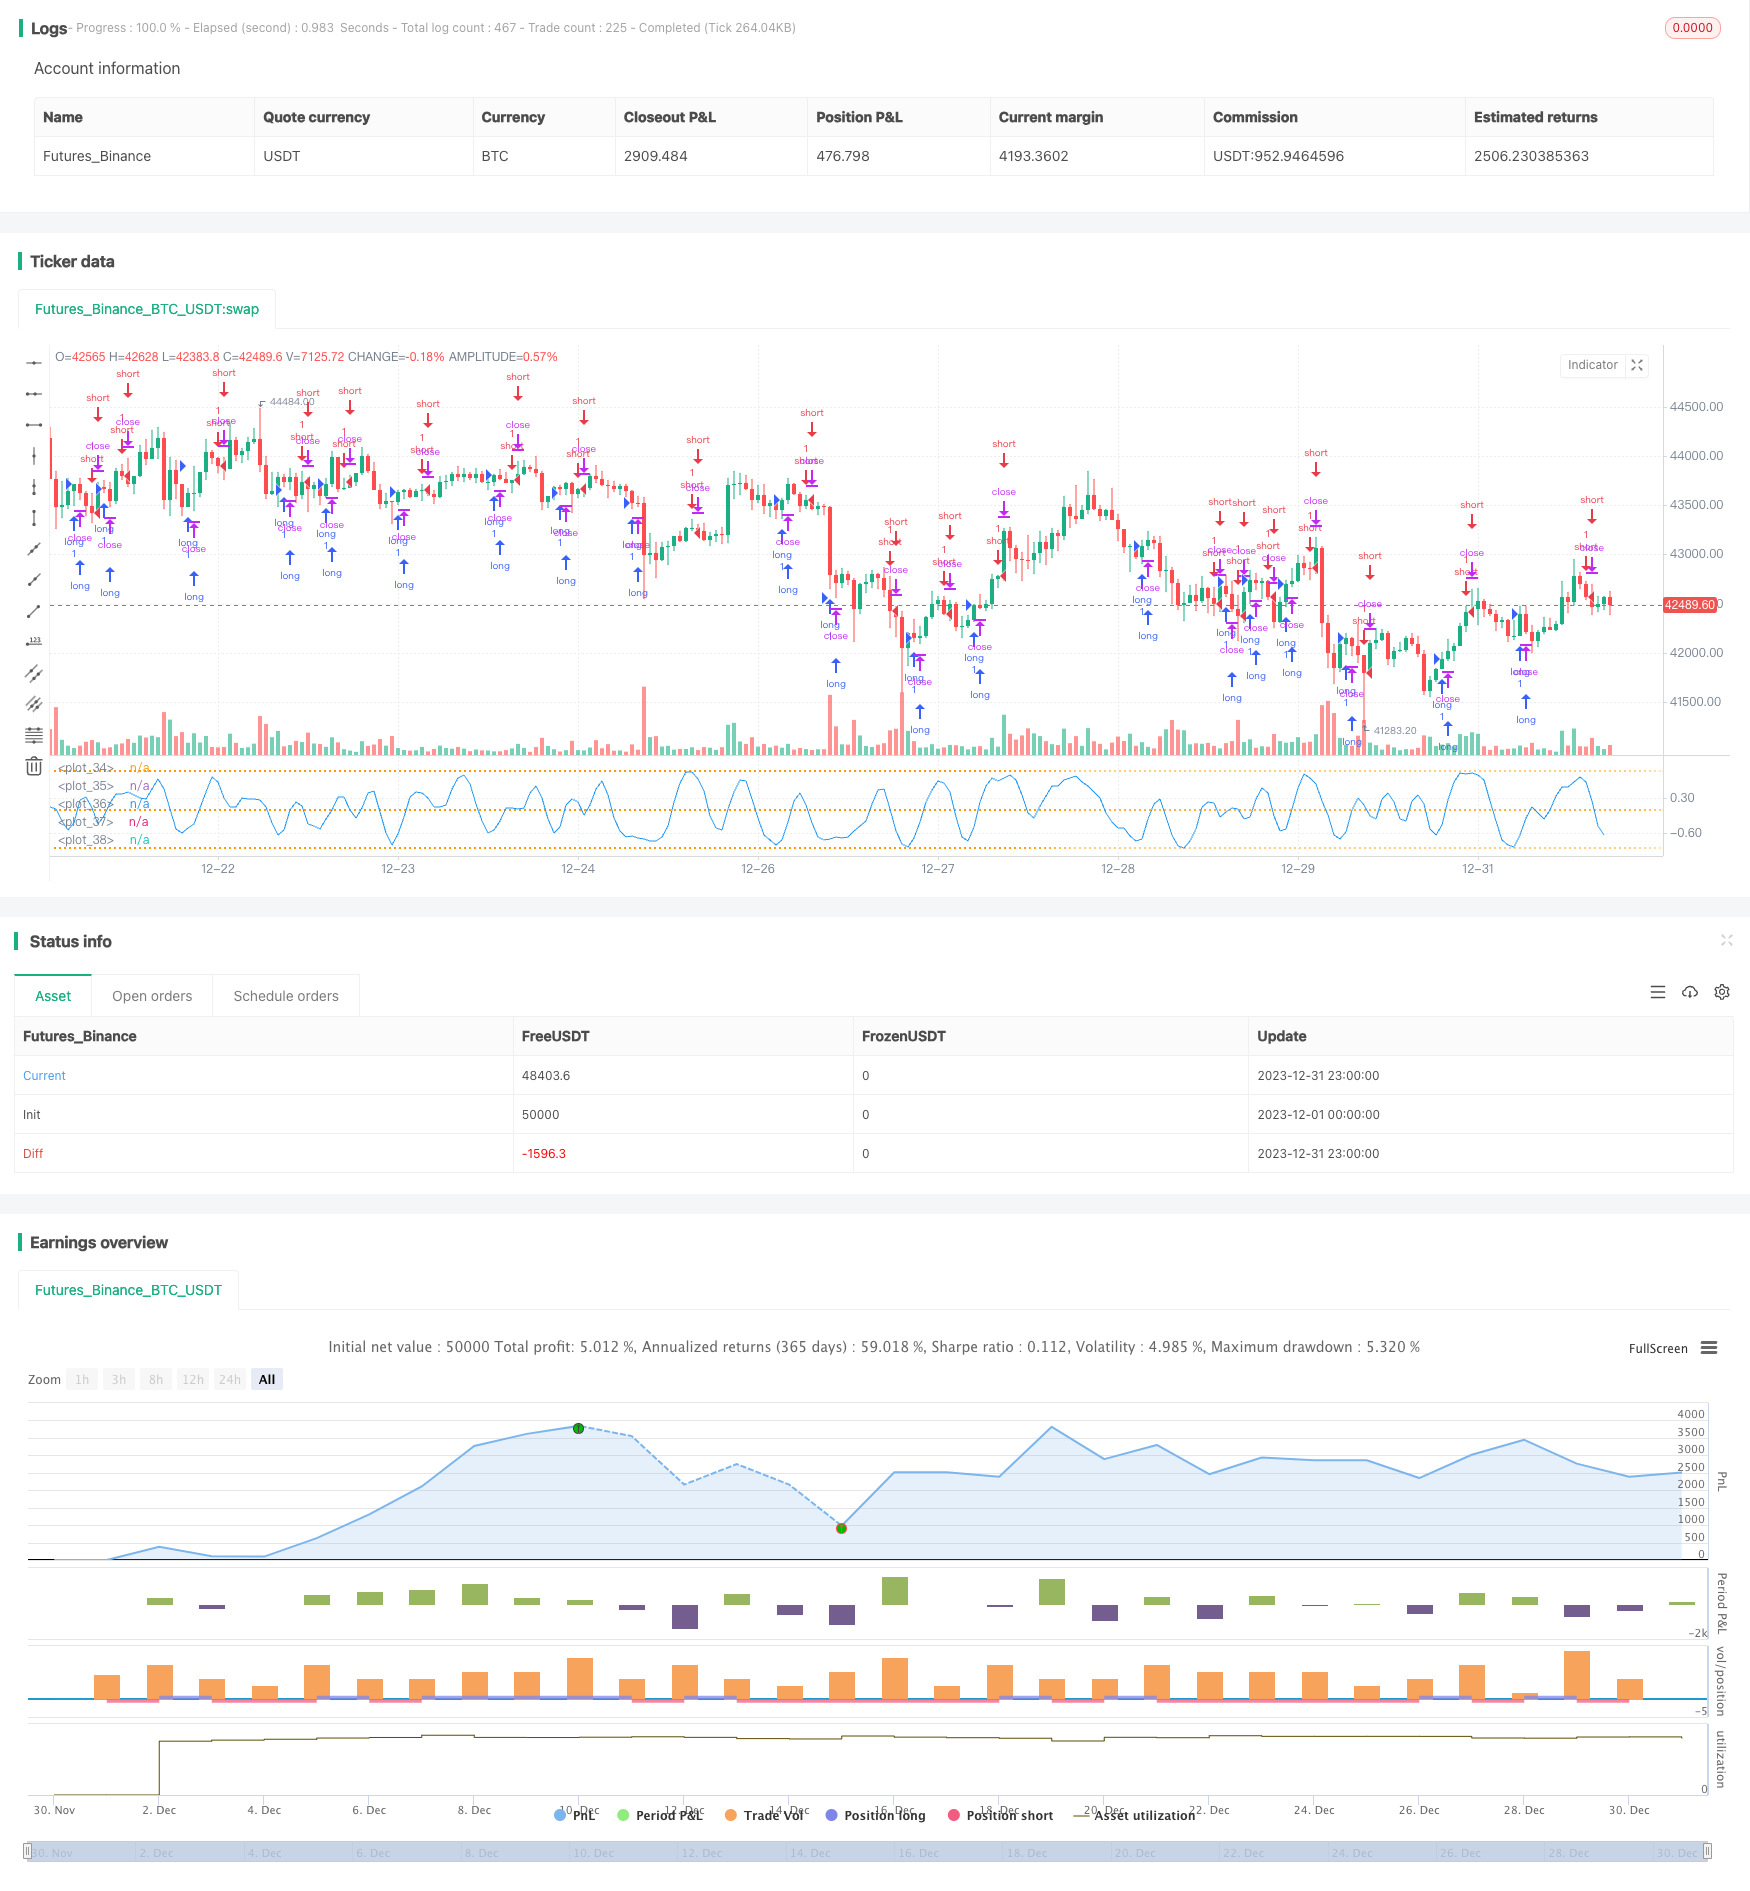
P-シグナル反転戦略は,統計パラメータと誤差関数に基づいて構築された確率空間信号の量化取引戦略である.これは,K線の一連の極値分布のパラメータを追跡し,動的に取引信号を取得して,市場の反転点を捕捉する.
戦略原則
この戦略の核心指標は,P-シグナルで,移動平均と標準差の統計パラメータを組み合わせ,高氏差関数によって-1から1の間の値にマッピングして,量的な判断指標を形成する.P-シグナルが正から負の反転時に空し,負から正の反転時に多し,反転戦略の論理を形成する.
策略パラメータには,Cardinality,ΔErf,および観察時間。Cardinalityはサンプル数を制御し,ΔErfはエラー関数のデッドゾーンを制御し,取引頻度を低下させます。観察時間は,策略の開始時間を制御します。
優位分析
P-シグナル反転戦略の最大の利点は,統計的パラメータの確率分布に基づいて,市場の特徴を効果的に判断し,反転の機会を捉えるということです.単一の技術指標と比較して,より多くの市場情報と組み合わせて,判断はより包括的で信頼できるものです.
さらに,この策略はパラメータ化設計仕様で,ユーザは自己のニーズに応じてパラメータ空間を調整して最適な組み合わせを探すことができます.これは,策略の適応性と柔軟性を保証します.
リスク分析
P-シグナル反転策の主要なリスクは,確率分布のパラメータに過度に依存し,異常データの影響で誤判に容易である.また,反転策の損益率は一般的に低い,単一利益は限られている.
Cardinalityパラメータを高め,サンプル量を増やすことでデータ異常の影響を減らすことができる.ΔErf範囲を適切に拡大し,取引頻度を低下させ,リスクを制御する.
最適化の方向
P-シグナル反転戦略は以下の点で最適化できます.
取引量急増などの特性を他の指標と組み合わせてフィルタリングする.
複数の時間枠で信号を検証し,判断の安定性を強化する.
損失を抑える戦略を導入し,単一損失を削減する.
パラメータを最適化して,最適の組み合わせを探し出し,率を上げます.
機械学習による判断パラメータの動的調整.
要約する
P-シグナル反転戦略は,立足確率分布が量化取引の枠組みを構築し,パラメータ設計が柔軟で,ユーザーフレンドリーである.それは,市場の統計的特性を効果的に判断し,反転の機会を捕捉する.この戦略は,多指標検証,ストップ・ロズ・オプティマイゼーションなどの手段によって,安定性と収益性をさらに強化することができる.それは,量化手段を利用したアルゴリズム取引を行うための高効率で信頼性の高い范例を提供する.
/*backtest
start: 2023-12-01 00:00:00
end: 2023-12-31 23:59:59
period: 1h
basePeriod: 15m
exchanges: [{"eid":"Futures_Binance","currency":"BTC_USDT"}]
*/

//@version=5
// **********************************************************************************************************
// This source code is subject to the terms of the Mozilla Public License 2.0 at https://mozilla.org/MPL/2.0/
// P-Signal Strategy RVS © Kharevsky
// **********************************************************************************************************
strategy('P-Signal Strategy RVS.', precision=3, process_orders_on_close=true, pyramiding=0,
     commission_type=strategy.commission.percent,
     commission_value=0.2)
// Parameters and const of P-Signal.
nPoints = input.int(title='Cardinality:', defval=4, minval=4, maxval=200, group='Parameters of strategy.')
ndErf = input.float(title='|ΔErf|:', defval=0, minval=0, maxval=1, step=0.01, group='Parameters of strategy.')
tStartDate = input(title='Start date:', defval=timestamp('30 Dec 1957 00:00 +0300'), group='Observation time.')
int nIntr = nPoints - 1
// Horner's method for the error (Gauss) & P-Signal functions.
fErf(x) =>
    nT = 1.0 / (1.0 + 0.5 * math.abs(x))
    nAns = 1.0 - nT * math.exp(-x * x - 1.26551223 +
     nT * (1.00002368 + nT * (0.37409196 + nT * (0.09678418 +
     nT * (-0.18628806 + nT * (0.27886807 + nT * (-1.13520398 +
     nT * (1.48851587 + nT * (-0.82215223 + nT * 0.17087277)))))))))
    x >= 0 ? nAns : -nAns
fPSignal(ser, int) =>
    nStDev = ta.stdev(ser, int)
    nSma = ta.sma(ser, int)
    nStDev > 0 ? fErf(nSma / nStDev / math.sqrt(2)) : math.sign(nSma)
// Data.
float nPSignal = ta.sma(fPSignal(ta.change(ohlc4), nIntr), nIntr)
float ndPSignal = math.sign(nPSignal[0] - nPSignal[1])
bool isStartDate = true
// Reversal Strategy.
strategy.entry('short', strategy.short, when=isStartDate and nPSignal > ndErf and ndPSignal < 0)
strategy.entry('long', strategy.long, when=isStartDate and nPSignal < -ndErf and ndPSignal > 0)
// Plotting.
hline(+1.0, color=color.new(color.orange, 70), linestyle=hline.style_dotted, editable=false)
hline(-1.0, color=color.new(color.orange, 70), linestyle=hline.style_dotted, editable=false)
hline(-ndErf, color=color.new(color.orange, 70), linestyle=hline.style_dotted, editable=false)
hline(ndErf, color=color.new(color.orange, 70), linestyle=hline.style_dotted, editable=false)
plot(nPSignal, color=color.new(color.blue, 0), style=plot.style_line)
// Table of state.
if barstate.isconfirmed
    var Table = table.new(position=position.bottom_right, columns=3, rows=1,
     frame_color=color.new(color.orange, 70), frame_width=1,
     border_color=color.new(color.orange, 70), border_width=1)
    table.cell(table_id=Table, column=0, row=0,
     text=strategy.position_size > 0 ? 'Long: ' + str.tostring(strategy.position_size) : 'Short: ' + str.tostring(strategy.position_size),
     text_color=strategy.position_size > 0 ? color.green : color.red)
    table.cell(table_id=Table, column=1, row=0,
     text='Net P/L: ' + str.tostring(strategy.netprofit, '#.#'),
     text_color=strategy.netprofit > 0 ? color.green : color.red)
    table.cell(table_id=Table, column=2, row=0,
     text='Open P/L: ' + str.tostring(strategy.openprofit, '#.#'),
     text_color=strategy.openprofit > 0 ? color.green : color.red)
// The end.