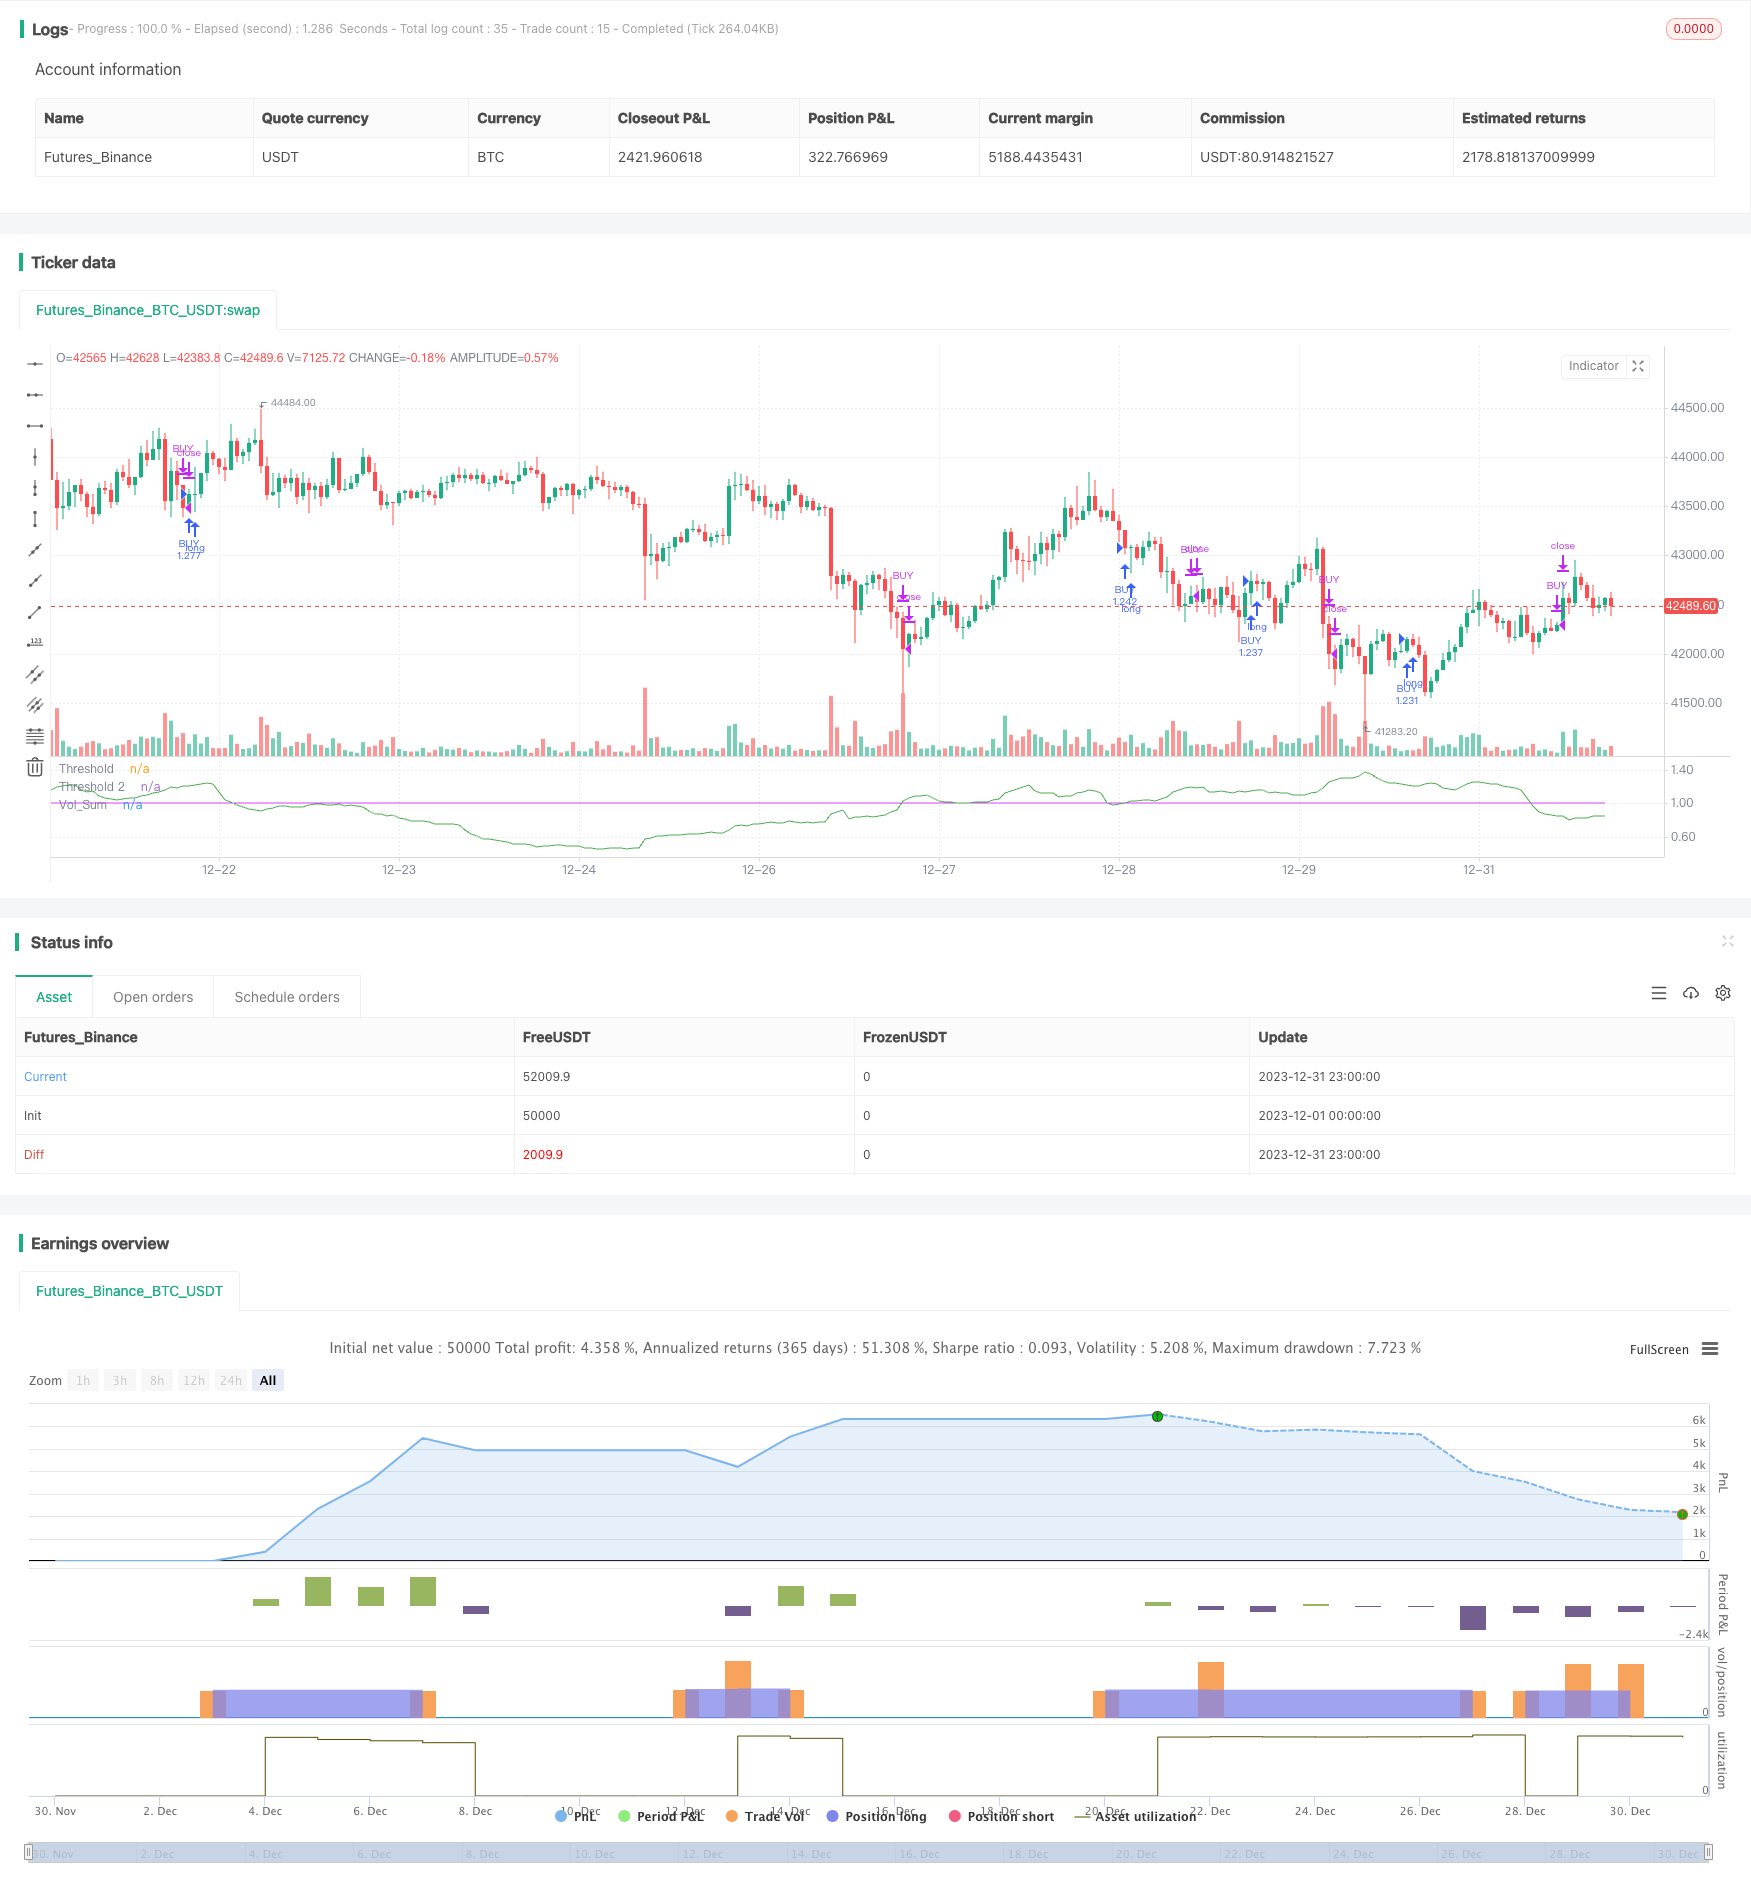
ボリュームオシレーターに基づくトレンドフォロー取引戦略
作成日:
2024-01-29 15:04:18
最終変更日:
2024-01-29 15:04:18
コピー:
2
クリック数:
834
1
フォロー
1664
フォロワー

概要
この戦略は,改訂された取引量の振動器指標に基づいて取引を行うトレンド追跡戦略である.これは取引量の平均線を使用して,取引量の増加したシグナルを識別し,ポジションへの入場または退出を判断する.価格自体とのトレンド判断と組み合わせて,価格の振動時に誤ったシグナルを生じないようにする.
戦略原則
- 取引量の平均線vol_sumを計算し,長さはvol_lengthで,vol_smoothの長さの平均線を平滑にする.
- vol_sumの上昇が値の値を超えると買入シグナルが生じ,値を超えると下落が売出シグナルを生じます.
- 誤差操作をフィルターするために,過去 direction根K線の閉盘価格と比較して,価格トレンドが上昇したときにのみ買い操作を行います.価格トレンドが低下したときにのみ売り操作を行います.
- 2つの値thresholdとthreshold2を設定する.thresholdは取引シグナルを生成するために,threshold2は損失を止めるために使用される.
- ステータスマシンによる注文管理の平仓論理.
優位分析
- 取引量指数は,市場における買取力の変化を捉え,信号の正確性を向上させる.
- 価格の動向を判断することで,価格の変動時に誤ったシグナルの発生を防ぐことができます.
- 2つの値を使用して,ポジションの開設と停止を行うことで,リスクをよりよくコントロールできます.
リスク分析
- 取引量指数自体が遅滞し,価格転換点を見逃す可能性があります.
- 誤ったパラメータ設定により,取引頻度が高くなり,信号が遅れる.
- 取引量が急増した場合,止損点は突破される可能性があります.
これらのリスクは,パラメータを調整し,指標の計算方法を最適化し,他の指標と組み合わせて確認することで制御できます.
最適化の方向
- 市場状況に応じて自動的に調整する指標パラメータを自己適応最適化することを検討することができます.
- 価格変動指数などの他の指標と組み合わせて,信号をさらに検証して,精度を向上させることができます.
- 信号判断に機械学習モデルを適用し,モデル判断を利用して精度を高める研究が可能である.
要約する
この戦略は,改善された取引量振動器を介して,価格の傾向を判断するのに補助し,二つの値を設定して,ポジションを開き,停止する.全体的に,比較的安定したトレンド追跡戦略である.最適化スペースは,パラメータ調整,信号フィルタリング,および停止の戦略の面で主にあります.全体的に,この戦略は,いくつかの実用的な価値があり,さらなる研究を最適化する価値があります.
ストラテジーソースコード
/*backtest
start: 2023-12-01 00:00:00
end: 2023-12-31 23:59:59
period: 1h
basePeriod: 15m
exchanges: [{"eid":"Futures_Binance","currency":"BTC_USDT"}]
*/

//@version=4
strategy('Volume Advanced', default_qty_type=strategy.percent_of_equity, default_qty_value=100, commission_type=strategy.commission.percent, commission_value=0.075, currency='USD')
startP = timestamp(input(2017, "Start Year"), input(12, "Start Month"), input(17, "Start Day"), 0, 0)
end    = timestamp(input(9999, "End Year"),   input(1, "End Month"),   input(1, "End Day"),   0, 0)
_testPeriod() =>
    iff(time >= startP and time <= end, true, false)

source = close
vol_length  = input(34, title = "Volume - Length")
vol_smooth  = input(200,title = "Volume - Smoothing")
volriselen  = input(21,  title = "Volume - Risinglength")
volfalllen  = input(13, title = "Volume - Fallinglength")
threshold   = input(1,"threshold")
threshold2  = input(1.2,step=0.1, title="Threshold 2")
direction = input(13,"amount of bars")


volsum  = sum(volume, vol_length) / (sum(volume, vol_smooth) / (vol_smooth / vol_length))


LongEntry  = (rising(volsum, volriselen) or crossover (volsum, threshold)) and close > close[direction]
ShortEntry = (rising(volsum, volriselen) or crossover (volsum, threshold)) and close < close[direction]
LongExit1  = falling (volsum,volfalllen)
ShortExit1 = falling (volsum,volfalllen)
LongExit2= (crossover(volsum, threshold2) and close < close[direction])


_state = 0
_prev = nz(_state[1])
_state := _prev

if _prev == 0
    if LongEntry
        _state := 1
        _state
    if ShortEntry
        _state := 2
        _state
if _prev == 1
    if ShortEntry or LongExit1
        _state := 0
        _state
if _prev == 2
    if LongEntry or ShortExit1
        _state := 0
        _state

_bLongEntry = _state == 1
_bLongClose = _state == 0

long_condition = _bLongEntry and close > close[direction]
strategy.entry('BUY', strategy.long, when=long_condition)

short_condition =  _bLongClose or LongExit2
strategy.close('BUY', when=short_condition)

plot(volsum,      color = color.green,    title="Vol_Sum")
plot(threshold, color = color.fuchsia, transp=50, title="Threshold")
plot(threshold2, color=color.white, transp = 50, title="Threshold 2")