価格ブレイクアウト戦略
作成日:
2024-01-30 15:07:08
最終変更日:
2024-01-30 15:07:08
コピー:
0
クリック数:
644
1
フォロー
1750
フォロワー
概要:この戦略は,ブリン・チャネル,KDJ指標,およびトレンド・トラッキングを利用して価格突破操作を行う戦略である. 突破点で買入および販売操作を行うことができ,リスクを管理するためにストップラインを設定できます.
戦略の原則:
- 価格の動向を判断するために,15日と30日の単純な移動平均を計算します.
- ブリン通路の上下を計算し,K線実体と結合してブリン通路の上下を突破して,買入と売却のタイミングを判断する.
- ランダムな指数RSIと組み合わせて,超買超売かどうかを判断する. RSIが50より大きいのは超買信号であり,RSIが50より小さいのは超売信号である.
- 価格上昇がブルリン通路を突破し,RSIが50より大きいときに買取シグナルを生成し,価格下落がブルリン通路を突破し,RSIが50より小さいときに売出シグナルを生成する.
- ATRを設定してリスクをコントロールする.
優位分析:
- この戦略は,ブルリンチャネル,RSI指数などの複数の指標を統合して取引信号を決定し,単一の指標による取引信号の誤りを効果的に回避します.
- トレンド判断と組み合わせて,整合と逆転で誤った取引シグナルを回避する.
- ATR ストップを設定して,各項目のリスクをコントロールする.
- 戦略操作は明確でシンプルで,理解しやすい.
リスクと改善:
- ブリン・チャネルは,輪郭の指標として,その上下軌道は絶対的なサポートとレジスタンス位ではない.価格が上下軌道を突破した後にストロップが打ち破られた場合がある.より緩やかなストップポイントを設定することも,時間ストップなどの他のストップ戦略を採用することもできる.
- RSI指標は,特定の市場では有効でない可能性があります. KDJ,MACDなどの他の指標と組み合わせて,より信頼性の高い超買超売判断を実現することを考慮することができます.
- 逆転や収束市場では誤信号が生じやすい.トレンドフィルターを加えることを検討し,トレンドが明らかである場合にのみ操作に参加する.
オピティマイゼーション:
- ブリン通路の周期数と標準差のパラメータをテストし,異なる品種の特性に適合するように最適化する.
- RSIの周期パラメータをテストし,最適化する.
- 追跡停止,時間停止などの他の止損戦略をテストします.
- 傾向判断指標と信号指標を組み合わせた多因子モデルを構築する.
結論から言うと
この戦略は,ブルリン・チャネル,RSIなどの複数の指標を総合的に使用して,買入と売却のタイミングを判断し,一定の取引信号の正確性を保証する一方で,リスクを制御するために損失を設定します.しかし,特定の品種に対してパラメータを最適化して,シグナルをより正確で信頼できるようにする必要があります.さらに,複数の要因を構成するより多くの要因を加えることも考えることができます.
ストラテジーソースコード
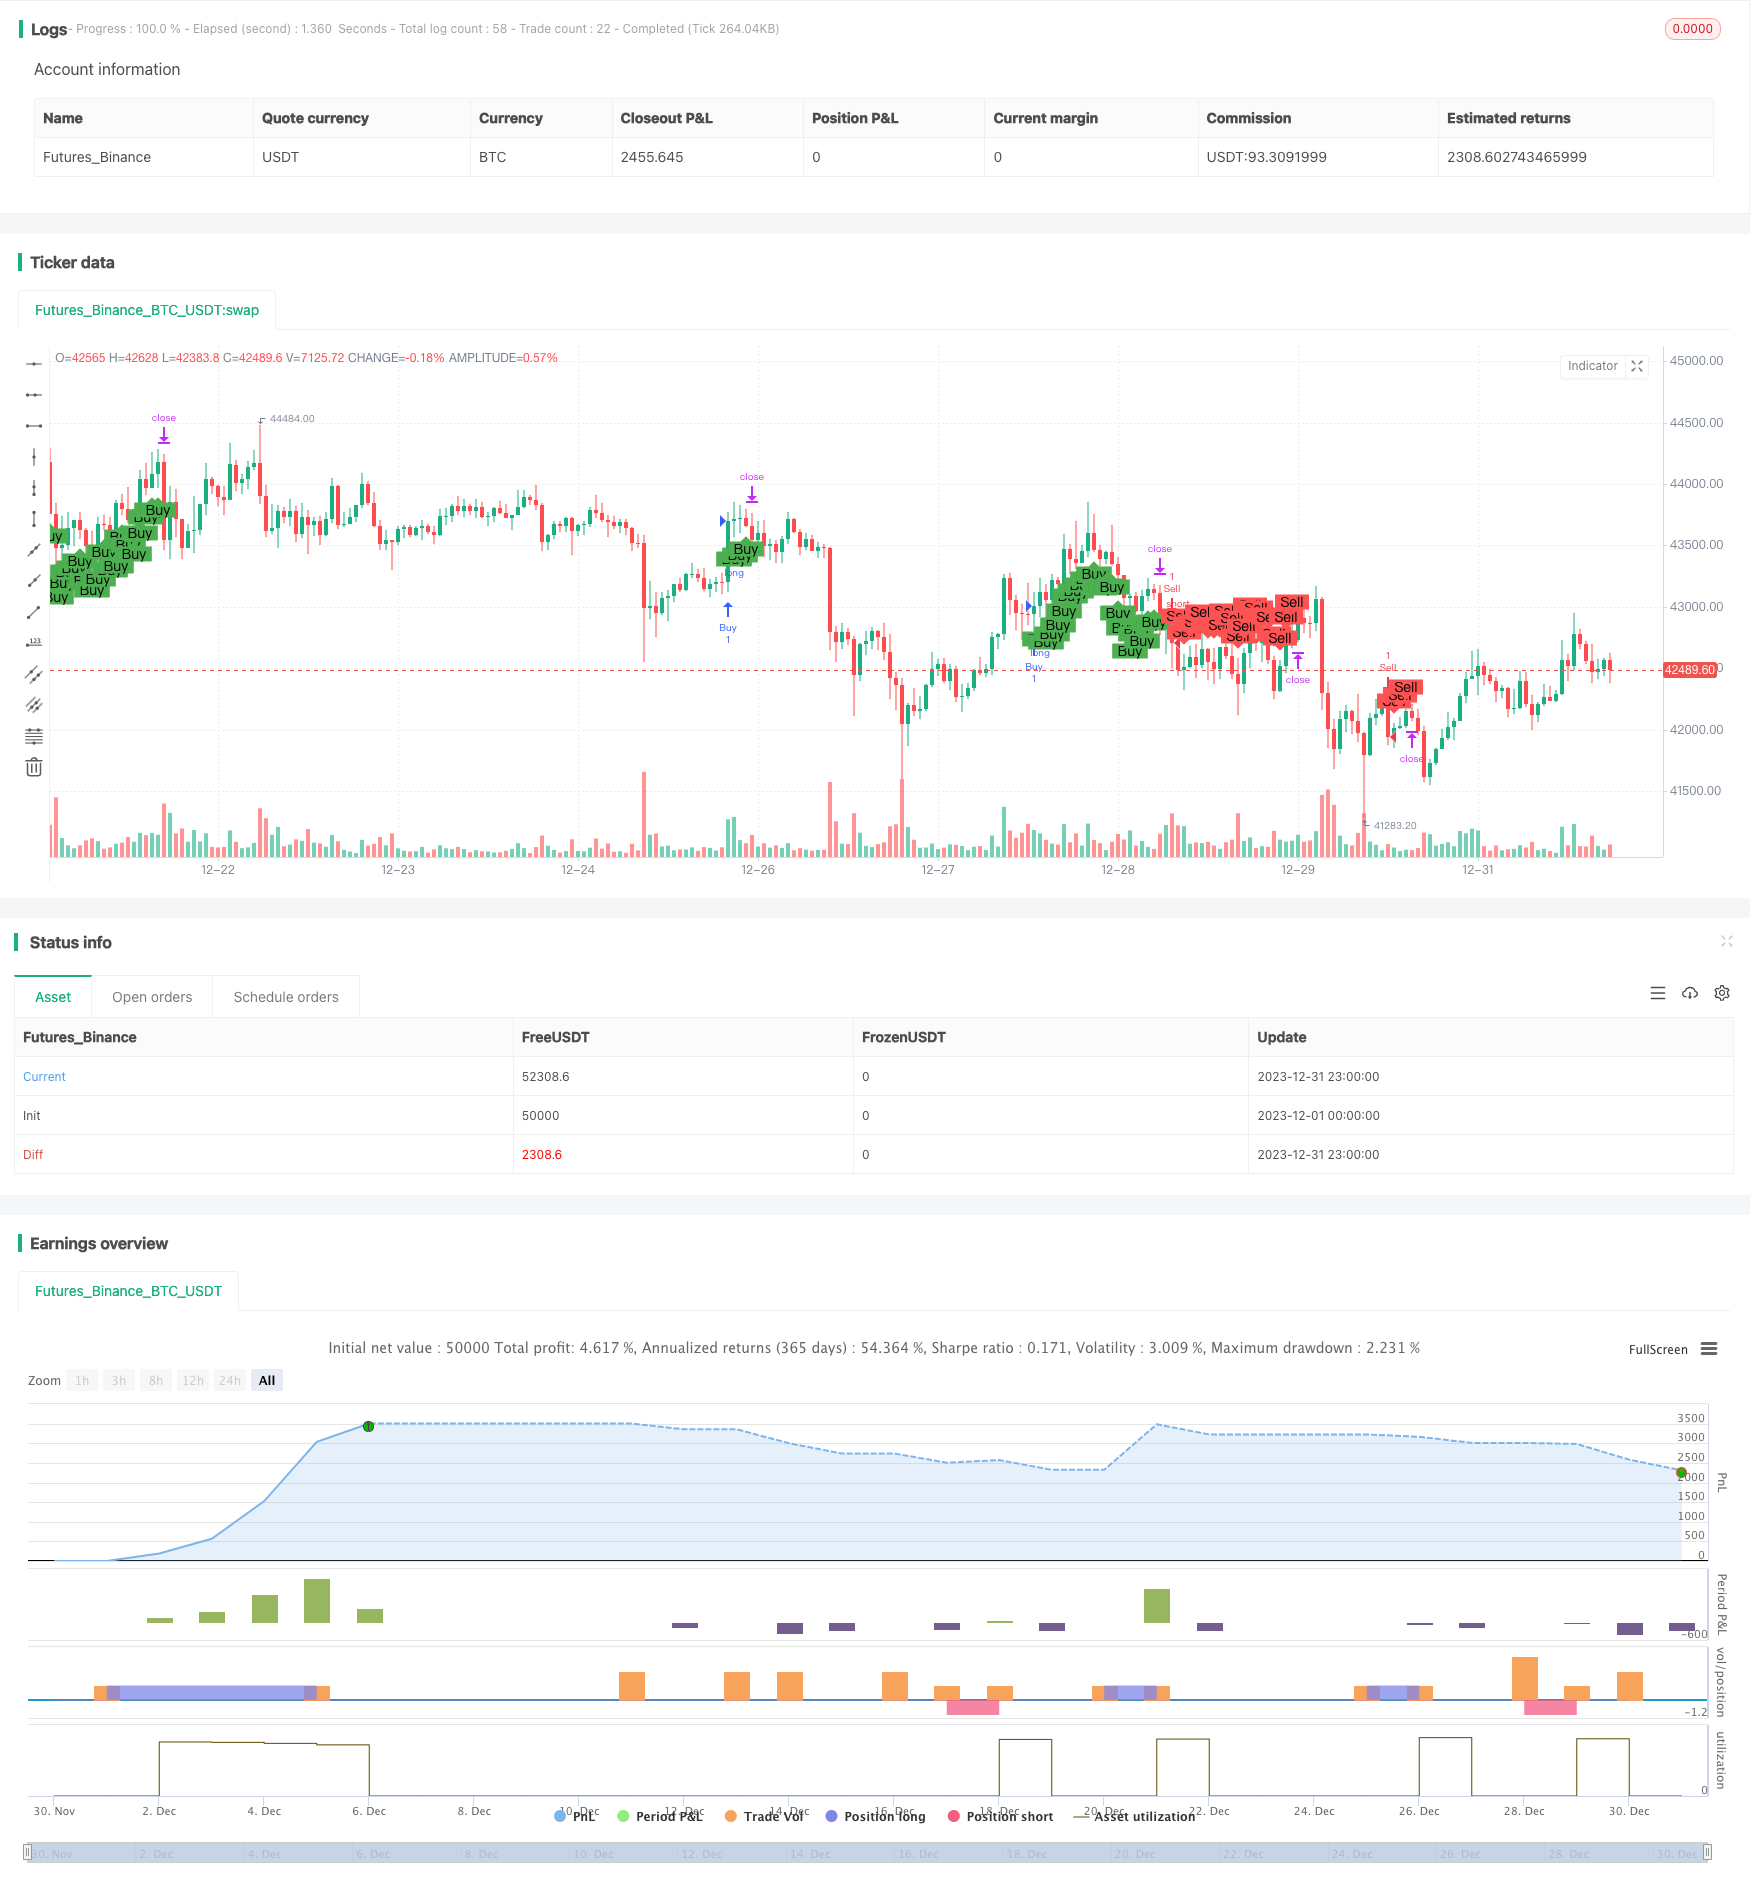
/*backtest
start: 2023-12-01 00:00:00
end: 2023-12-31 23:59:59
period: 1h
basePeriod: 15m
exchanges: [{"eid":"Futures_Binance","currency":"BTC_USDT"}]
*/

//@version=4
strategy("Custom Strategy", overlay=true)

length = 14
mult = 0.75
atr = atr(length) * mult

// Moving averages
ma15 = sma(close, 15)
ma30 = sma(close, 30)

// Bullish Engulfing pattern
bullishEngulfing = close[1] < open[1] and close > open and close[1] < open and close > open[1]

// Bearish Engulfing pattern
bearishEngulfing = close[1] > open[1] and close < open and close[1] > open and close < open[1]

// RSI
rsi = rsi(close, length)

// Buy condition
if (bullishEngulfing and close[1] > ma15 and rsi > 50)
    strategy.entry("Buy", strategy.long)
    strategy.exit("Sell", "Buy", stop=close - atr)

// Sell condition
if (bearishEngulfing and close[1] < ma15 and rsi < 50)
    strategy.entry("Sell", strategy.short)
    strategy.exit("Cover", "Sell", stop=close + atr)

// Plotting
plotshape(series=strategy.position_size > 0, title="Buy", location=location.belowbar, color=color.green, style=shape.labelup, text="Buy")
plotshape(series=strategy.position_size < 0, title="Sell", location=location.abovebar, color=color.red, style=shape.labeldown, text="Sell")