ダブルRSI取引戦略
作成日:
2024-01-30 15:21:47
最終変更日:
2024-01-30 15:21:47
コピー:
1
クリック数:
930
1
フォロー
1750
フォロワー
概要
二重RSI取引戦略は,相対的に強い指数 ((RSI)) に基づく量的な取引戦略である.この戦略は,同時,高速RSIと遅いRSIを取引信号として使用し,信号の質を向上させ,偽信号をフィルターすることを目的として,二重確認を実現する.
戦略原則
この戦略は,2つの異なる周期のRSIを主要取引指標として使用しています. 急速RSI周期は5日であり,短期的な超買い超売りを捉えます. 遅いRSI周期は14日であり,中長期の傾向と重要なサポートの抵抗を判断します.
具体的な取引ルールは次のとおりです。
- 速度のRSIが70を超え,緩やかなRSIが50を超えると,多めにします. 速度のRSIが30を超え,緩やかなRSIが50を超えると,空きを取ります.
- 多損ストップラインは,急速RSIの下で55を突破し,空白ストップラインは,急速RSI上で45を突破します.
この戦略は,高速または遅いRSIの組み合わせを使用して,異なる周期間の互換性を実現し,高品質の取引シグナルを生むために,中長期のトレンドを効果的に識別し,超買いと超売りを確認します.双重RSIフィルタリングメカニズムはまた,偽の突破による取引のノイズを減らすことができます.
優位分析
二重RSI戦略の最大の利点は,偽信号を効果的にフィルターして,信号の質を向上させ,不必要な取引を減らすこと,取引頻度を低下させることにある.具体的利点は次のとおりである.
- RSIコンポーネントは,短期,中期および長期の超買超売点を識別し,信号の正確性を向上させるために使用されます.
- ダブルRSIフィルタリングメカニズム,効果的ノイズ削減,を避ける
- 取引コストとスライドポイントの損失を減らすのに役立つ低取引頻度
- 単一損失と最大回収を制御する止損メカニズム
リスク分析
二重RSI策略には,以下の要因が伴うリスクがあります.
- RSIの遅滞は取引の遅延につながる可能性がある
- 双重フィルタリングは,取引の機会を逃しているかもしれない.
- 極端な行動のシステム上のリスクは 完全に回避できない
リスクは以下の方法で軽減できます.
- 迅速なRSIのパラメータを適切に調整して,感受性を高めます.
- ポジション開設と停止条件の最適化,リスクと利益のバランス
- トレンドシステム,機械学習などのアルゴリズムと組み合わせる
最適化の方向
双層RSI戦略のさらなる最適化には余裕があり,主な方向は以下の通りです.
- RSIパラメータを動的に最適化し,市場状況に応じて自動的に調整します.
- 波動率に基づくリスク管理モジュールを追加
- テキスト分析やソーシャルデータなどの代替信号
- 機械学習モデルによる補助フィルタリング
戦略の収益性,安定性,適応性をさらに向上させることができます.
要約する
二重RSI戦略は,全体として非常に実用的な量化取引戦略である. それは,トレンド追跡,オーバーバイオーバーセール識別および二重フィルターなどの仕組みを融合して,比較的完全な取引システムを形成している. この戦略は,リスクを制御し,取引頻度を減らすなどの点で優れたパフォーマンスを発揮し,中長期にわたって保持するのに適しています.
ストラテジーソースコード
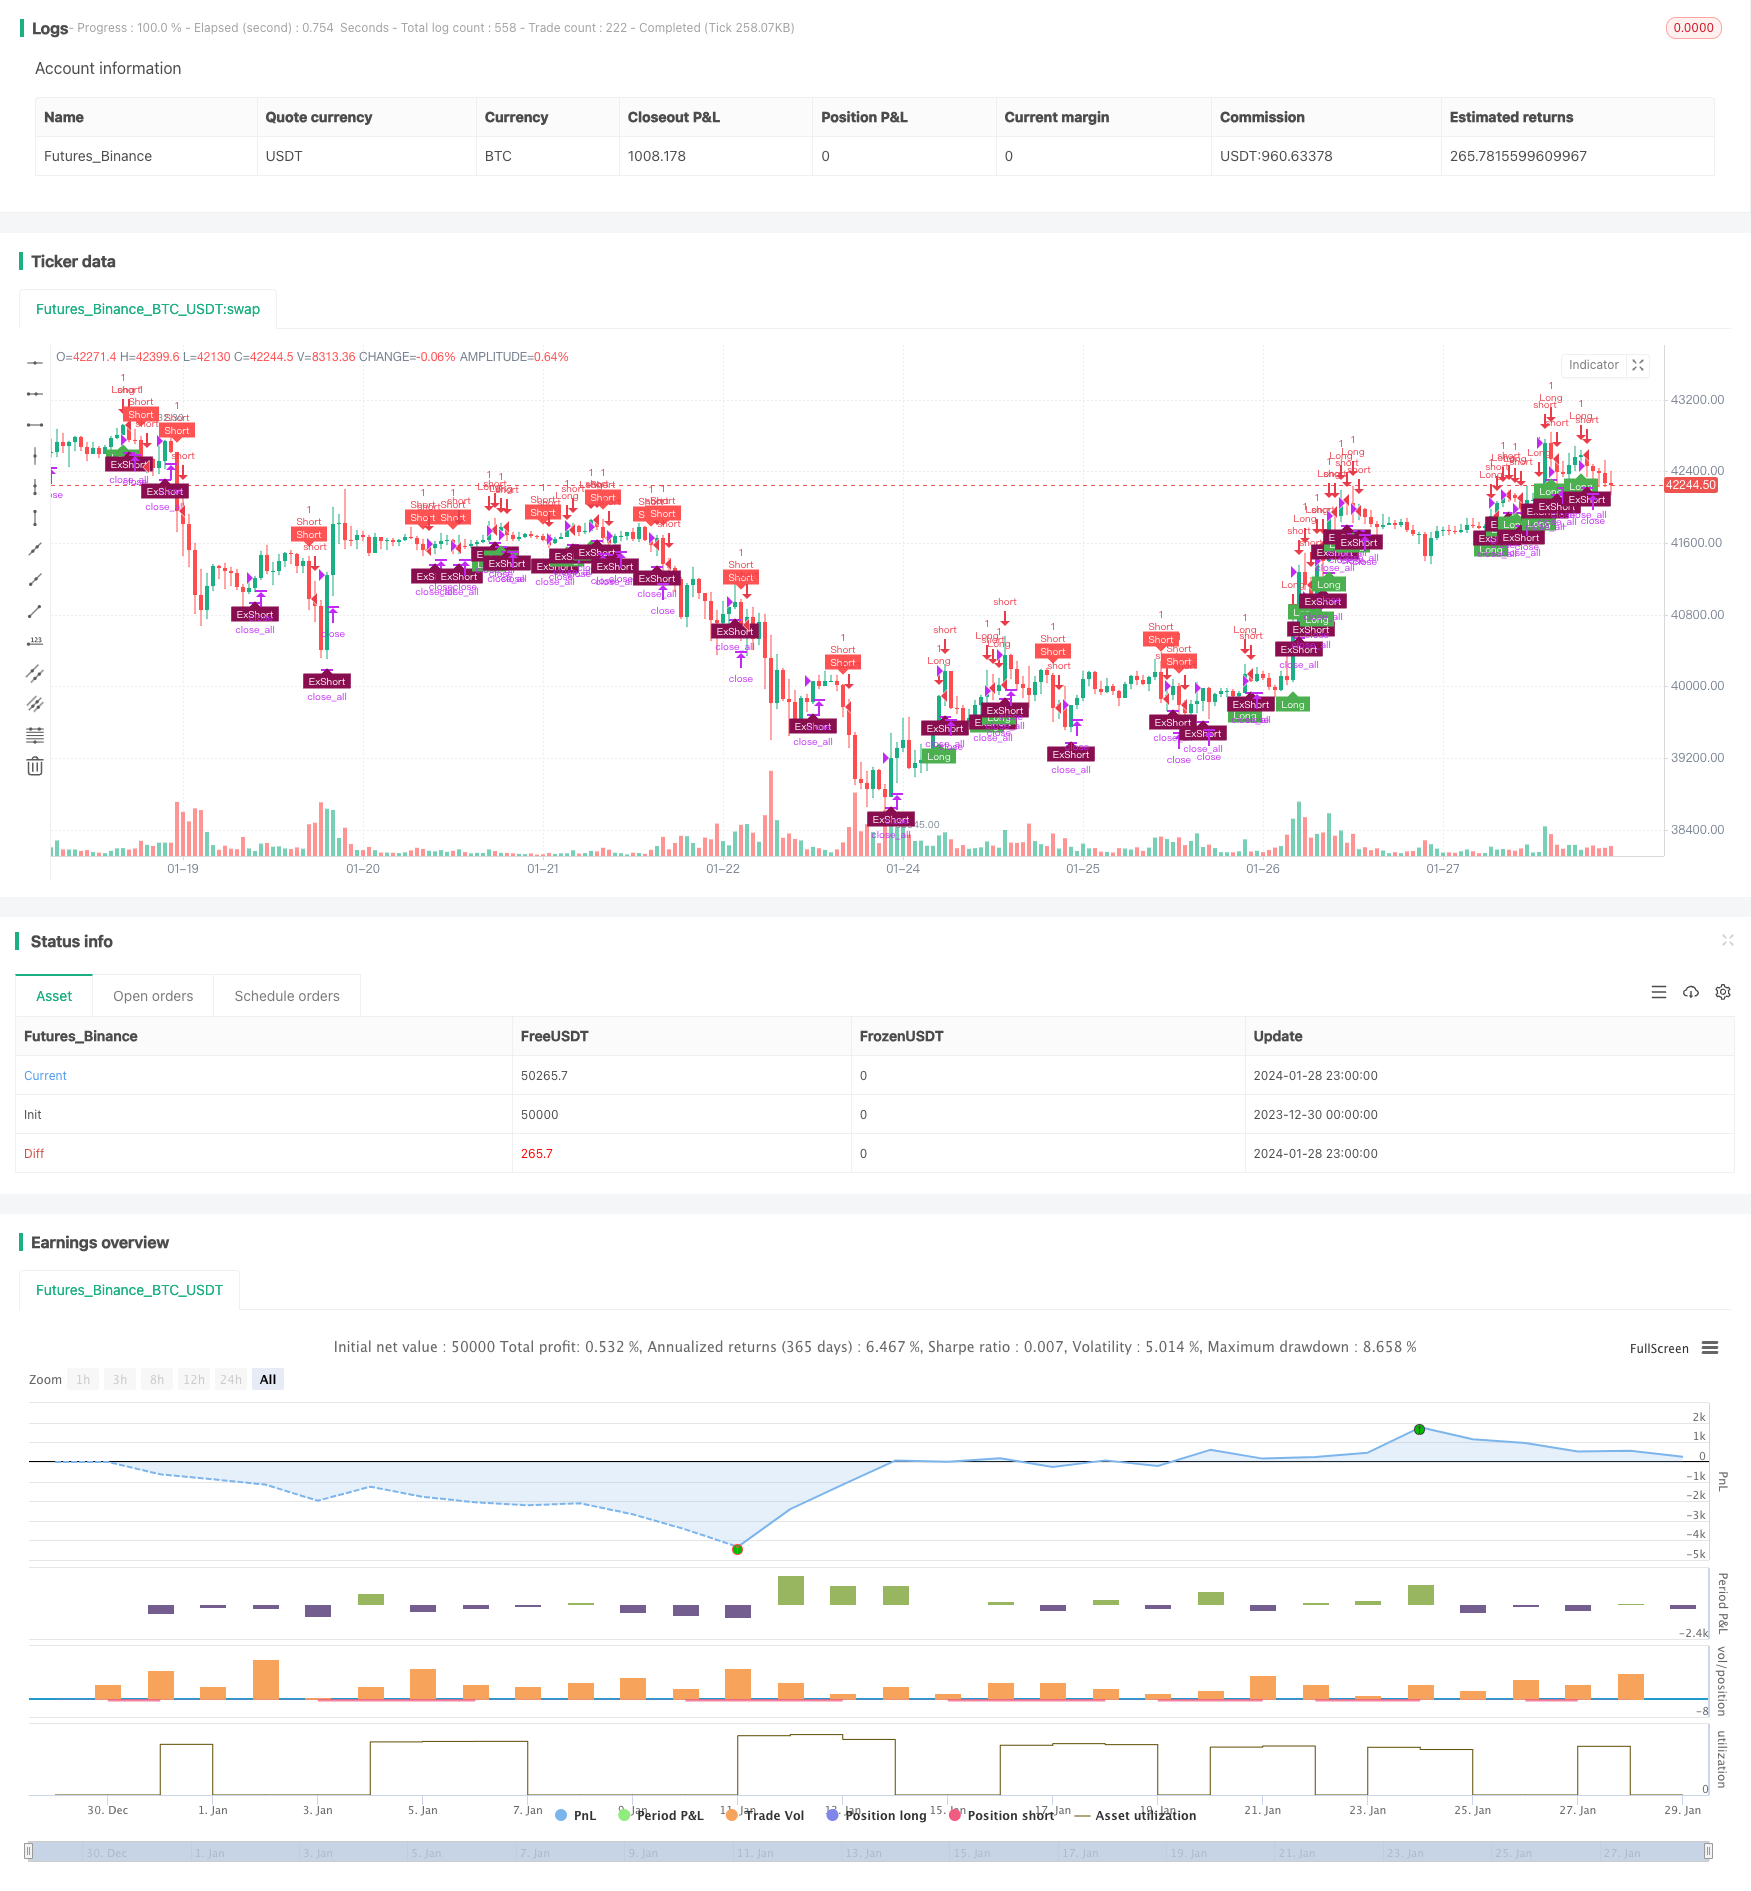
/*backtest
start: 2023-12-30 00:00:00
end: 2024-01-29 00:00:00
period: 1h
basePeriod: 15m
exchanges: [{"eid":"Futures_Binance","currency":"BTC_USDT"}]
*/

// This source code is subject to the terms of the Mozilla Public License 2.0 at https://mozilla.org/MPL/2.0/
// © Ankit_Quant
//@version=4

// ********************************************************************************************************
// This was coded live during webinar on Backtesting in Tradingview
// That was held on 16-Jan-21
// Aim of this strategy is to code a Double Decker RSI Strategy - Rules of Strategy are given in Description
// *********************************************************************************************************

// Identifier of strategy or an indicator (study())
strategy(title="Strategy- Double Decker RSI",shorttitle='Strategy - Double Decker RSI',overlay=true)

// ********************
// INPUTS
// ********************
// RSI Lookback Periods
slowRSI=input(defval=14,title='Slow RSI Period',type=input.integer)
fastRSI=input(defval=5,title='Fast RSI Period',type=input.integer)

// Time Period Backtesting Input
start_year=input(defval=2000,title='Backtest Start Year',type=input.integer)
end_year=input(defval=2021,title='Backtest End Year',type=input.integer)

//Specific Years to Test Starategy
timeFilter=true


// Trade Conditions and signals
long = rsi(close,fastRSI)>70 and rsi(close,slowRSI)>50
short = rsi(close,fastRSI)<40 and rsi(close,slowRSI)<50
long_exit=rsi(close,fastRSI)<55
short_exit=rsi(close,fastRSI)>45

//positionSize - 1 Unit (also default setting)
positionSize=1

// Trade Firing - Entries and Exits
if(timeFilter)
    if(long and strategy.position_size<=0)
        strategy.entry(id='Long',long=strategy.long,qty=positionSize)
    if(short and strategy.position_size>=0)
        strategy.entry(id="Short",long=strategy.short,qty=positionSize)
    if(long_exit and strategy.position_size>0)
        strategy.close_all(comment='Ex')
    if(short_exit and strategy.position_size<0)
        strategy.close_all(comment='Ex')


// Plot on Charts the Buy Sell Labels
plotshape(strategy.position_size<1 and long,style=shape.labelup,location=location.belowbar,color=color.green,size=size.tiny,text='Long',textcolor=color.white)
plotshape(strategy.position_size>-1 and short,style=shape.labeldown,location=location.abovebar,color=color.red,size=size.tiny,text='Short',textcolor=color.white)
plotshape(strategy.position_size<0 and short_exit?1:0,style=shape.labelup,location=location.belowbar,color=color.maroon,size=size.tiny,text='ExShort',textcolor=color.white)
plotshape(strategy.position_size>0 and long_exit?1:0,style=shape.labeldown,location=location.abovebar,color=color.olive,size=size.tiny,text='ExLong',textcolor=color.white)