クロスオーバー短期ブレイクスルー反転5EMA戦略
作成日:
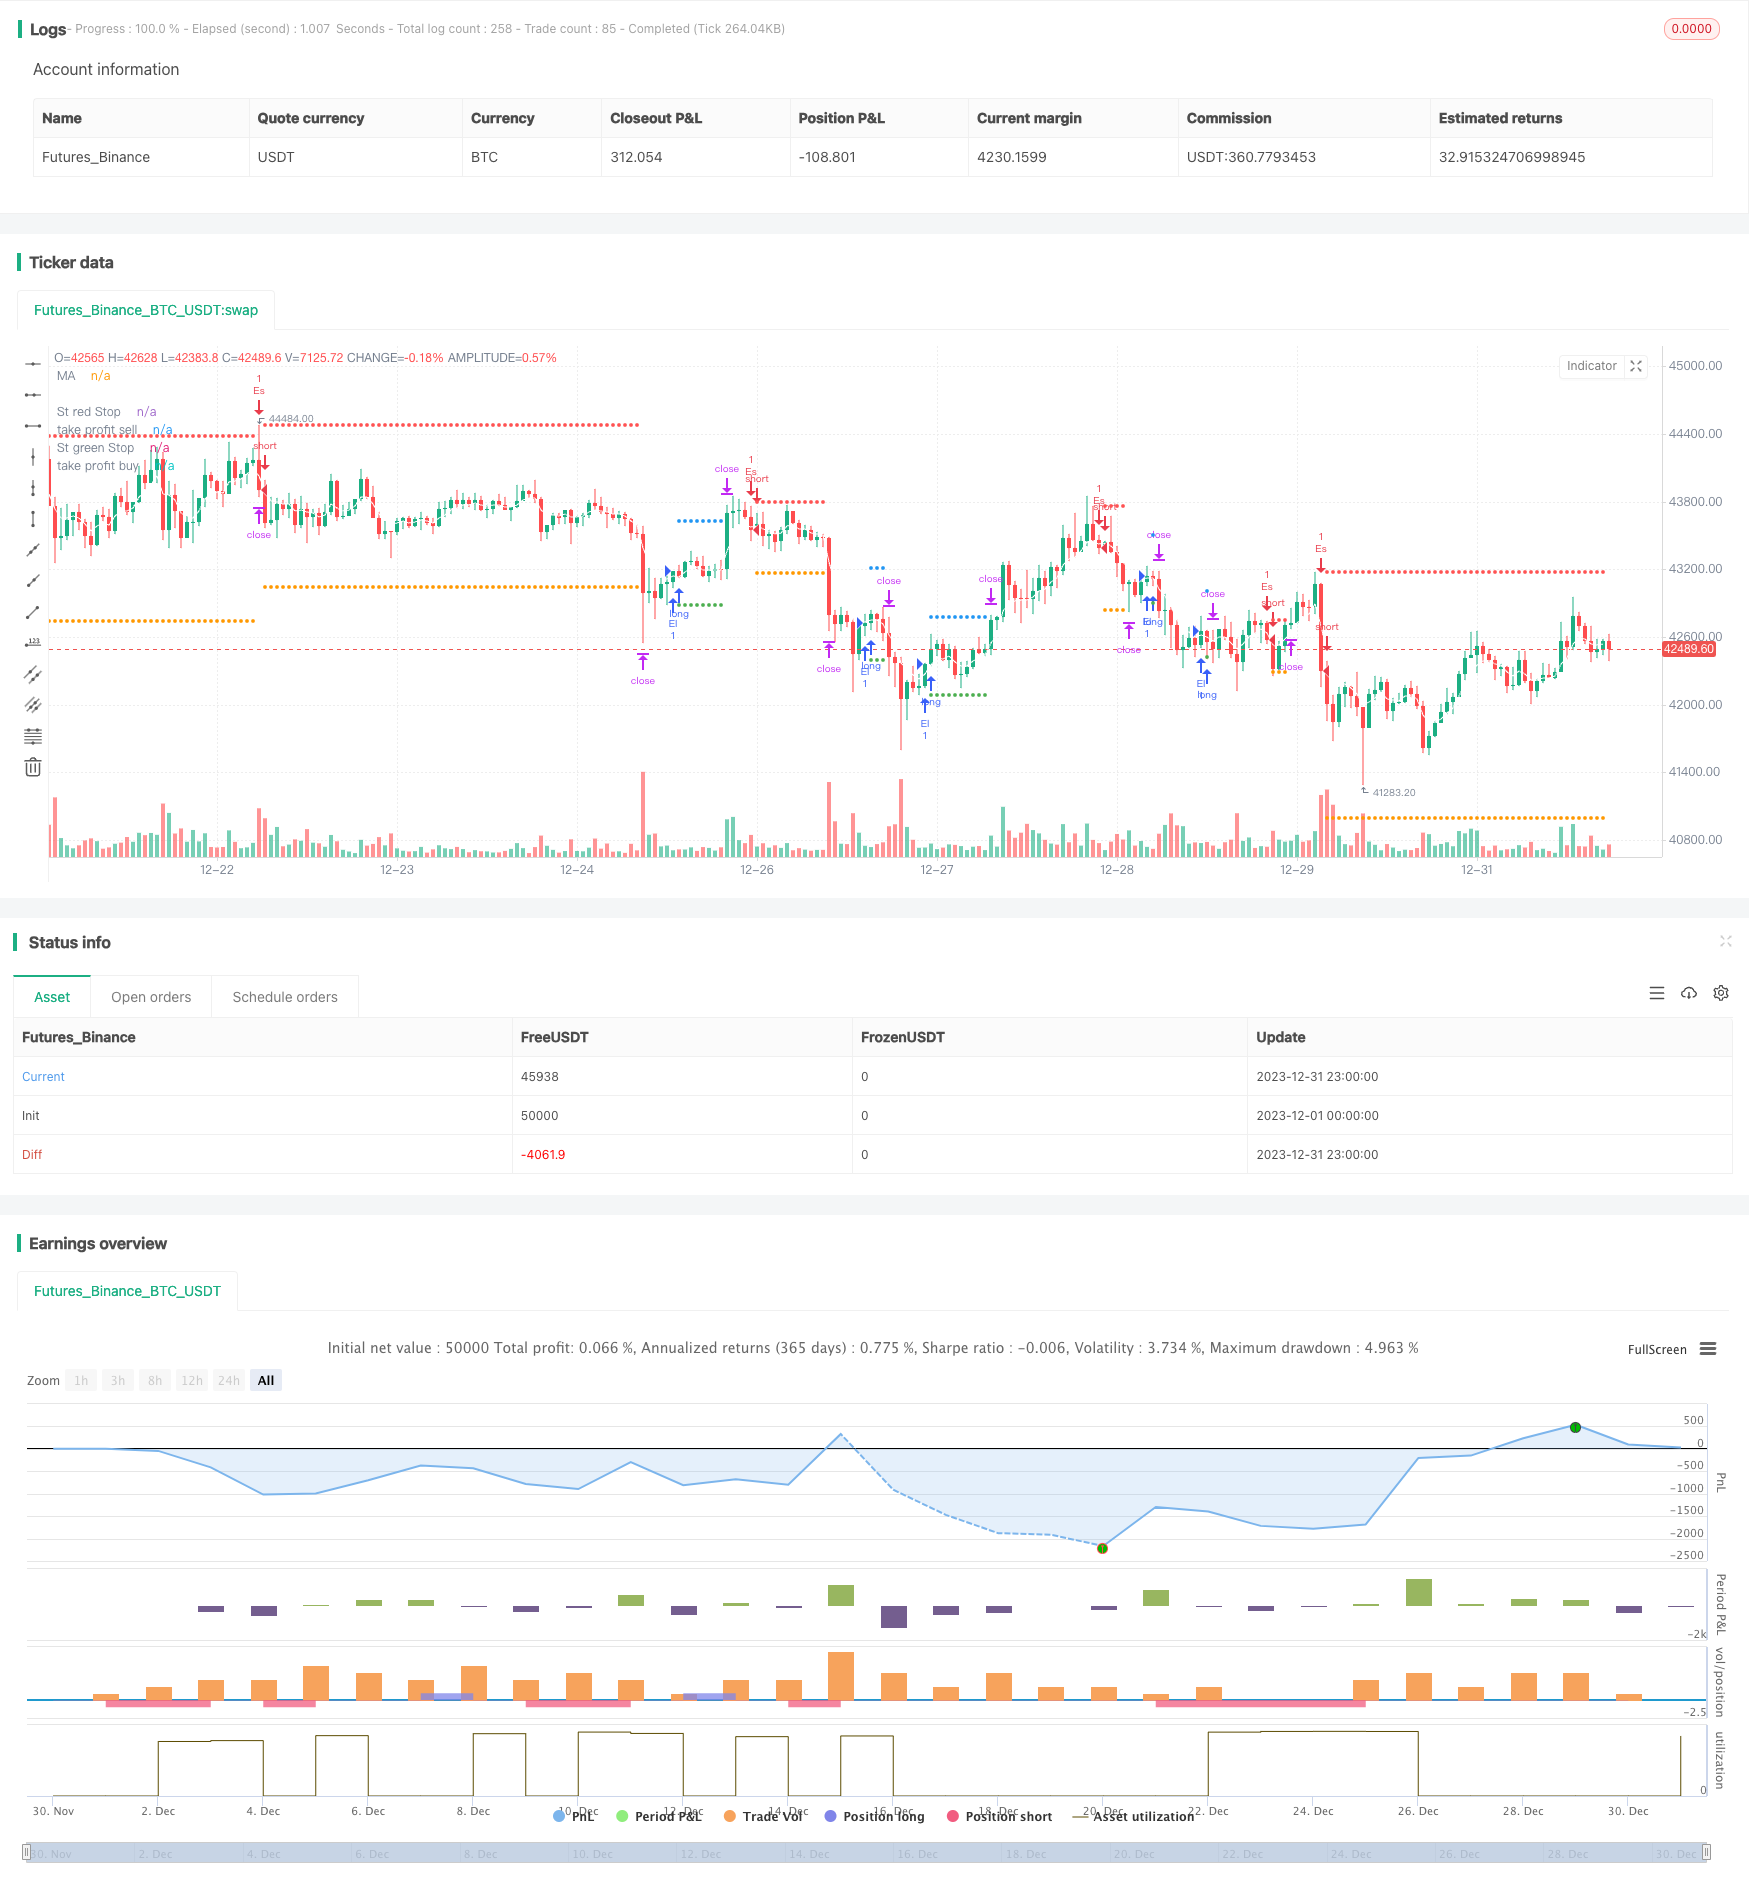
2024-01-30 15:30:19
最終変更日:
2024-01-30 15:30:19
コピー:
0
クリック数:
811
1
フォロー
1751
フォロワー
この記事では,5EMA指数に基づくショートライン突破逆転取引戦略について説明します.この戦略は,5EMA指数を使用して価格の傾向を判断し,価格がEMAを突破したときに逆転取引を行う.
戦略概要
この戦略は,ショートライン量化戦略であり,主に高周波取引に使用されます.戦略は,多頭と空頭信号を同時に判断し,双方向取引を行うことができます.価格が5EMA指標を破るとき,取引信号を生じ,破口の方向に応じて多頭または空頭に入ります.
戦略の優位性は,ショートラインの価格逆転の機会を捕捉し,迅速に場に入ることにある。リスクは,主に偽突破による損失からくる。,最適化パラメータによって損失のリスクを減らすことができる。
戦略原則
5サイクルEMA指標を用いて価格の短期トレンドを判断する
価格がEMAを突破したかどうかを判断する
価格が上から下へと上昇し,EMAを突破すると,セールシグナルが作られます.
価格が下から上昇してEMAを突破すると,買い信号が生じる
ストップとストップポイントを設定し,単一損失を制限します.
EMA指標は,短期的なトレンドを効果的に判断できるため,価格が明らかに逆転したときに取引機会を迅速に捉えることができます. 5EMAのパラメータは,市場に対して迅速に反応し,高周波取引に適しています.
戦略的優位性
- 短線取引の機会を捉えるための高周波の迅速な反応
- バイ・ウェイ・トレードで,同時多空の取引が可能です.
- ストップダメージは合理的で,単一の損失は限られている.
- シンプルなパラメータ設定で,戦略の最適化が容易
戦略的リスクと解決策
- 偽の突破による不必要な損失
- EMA周期パラメータを最適化し,指標の安定性を確保する
- 取引頻度が高すぎると 取引が激しくなります.
- 取引の最大回数を制限する
戦略最適化の方向性
- EMA指標のパラメータを最適化して,最適な周期組み合わせを探します.
- フィルターを増やして 偽突破の確率を減らす
- 取引の最大回数を制限する
- 他の指標と組み合わせてトレンドの方向を判断する
要約する
この戦略は,全体的に非常に実用的なショートライン突破戦略である.価格逆転を判断するためにEMA指標を使用することは,非常に簡単で有効であり,取引を量化するための重要なツールである.パラメータの最適化と風力制御の設定により,戦略の勝率を大幅に向上させることができる.これは推奨される.
ストラテジーソースコード
/*backtest
start: 2023-12-01 00:00:00
end: 2023-12-31 23:59:59
period: 1h
basePeriod: 15m
exchanges: [{"eid":"Futures_Binance","currency":"BTC_USDT"}]
*/

// This Pine Script™ code is subject to the terms of the Mozilla Public License 2.0 at https://mozilla.org/MPL/2.0/
// © samscripter

//@version=5
strategy("5 ema strategy",overlay = true,process_orders_on_close = true)

// Choose trade direction

t_dir = input.string("Both", title="Trade Direction",options=["Long", "Short", "Both"],group = 'Trade Direction Set')

long_side  = t_dir == "Long" or t_dir == "Both"
short_side = t_dir == "Short" or t_dir == "Both"

// number of trade
mx_num =input.int(4,title = 'number Of trade',group = 'Maximum Number Of Trade')
var hi =0.0
var lo =0.0

var group_ma1="Ema Set"

//Ema 1
on_ma=input.bool(true,"Enable EMa 1 Plot On/Off"  ,group =group_ma1)
ma_len= input.int(5, minval=1, title="Ema Length",group =group_ma1)
ma_src = input.source(close, title="Ema Source"   ,group = group_ma1)
ma_out = ta.ema(ma_src, ma_len)

// buy and sell ema condition
plot(on_ma?ma_out:na, color=color.white, title="MA")


if close>ma_out and open>ma_out and low>ma_out and high>ma_out
    lo:=low

if close<ma_out and open<ma_out and low<ma_out and high<ma_out
    hi:=high

// condition when price is crossunder lo take sell and when price crossoing hi take buy
var buyp_sl =float(na)
var sellp_sl =float(na)

//count number trade since day stra
var count_buysell=0

if  close>hi[1]
    if strategy.position_size==0 and count_buysell<mx_num and long_side
        strategy.entry('El',strategy.long,comment = 'Long')
        count_buysell:=count_buysell+1
        buyp_sl:=math.min(low,low[1])
    hi:=na
if  close<lo[1]
    if strategy.position_size==0 and count_buysell<mx_num and short_side
        strategy.entry('Es',strategy.short,comment = 'short')
        count_buysell:=count_buysell+1
        sellp_sl:=math.max(high,high[1])
    lo:=na

//take profit multiply

tpnew = input.float(title="take profit", step=0.1, defval=1.5, group='Tp/SL')


//stop loss previous candle high and previous candle low
buy_sl = ta.valuewhen(strategy.position_size != 0 and strategy.position_size[1] == 0,buyp_sl , 0)
sell_sl= ta.valuewhen(strategy.position_size != 0 and strategy.position_size[1] == 0,sellp_sl, 0)

//take profit
takeProfit_buy = strategy.position_avg_price - ((buy_sl - strategy.position_avg_price) *tpnew)
takeProfit_sell = strategy.position_avg_price - ((sell_sl - strategy.position_avg_price) *tpnew)


//  Submit exit orders
if strategy.position_size > 0
    strategy.exit(id='XL', stop=buy_sl,limit=takeProfit_buy,comment_loss = 'Long Sl',comment_profit = 'Long Tp')

if strategy.position_size < 0
    strategy.exit(id='XS', stop=sell_sl,limit=takeProfit_sell,comment_loss = 'Short Sl',comment_profit = 'Short Tp')

//plot data
plot(series=strategy.position_size < 0 ?sell_sl : na, style=plot.style_circles, color=color.red, linewidth=2, title="St red Stop")
plot(series=strategy.position_size > 0 ?buy_sl  : na, style=plot.style_circles, color=color.green, linewidth=2, title="St green Stop")


// plot take profit
plot(series=strategy.position_size < 0 ? takeProfit_sell : na, style=plot.style_circles, color=color.orange, linewidth=2, title="take profit sell")
plot(series=strategy.position_size > 0 ? takeProfit_buy: na, style=plot.style_circles, color=color.blue, linewidth=2, title="take profit buy")

if ta.change(time('D'))
    count_buysell:=0