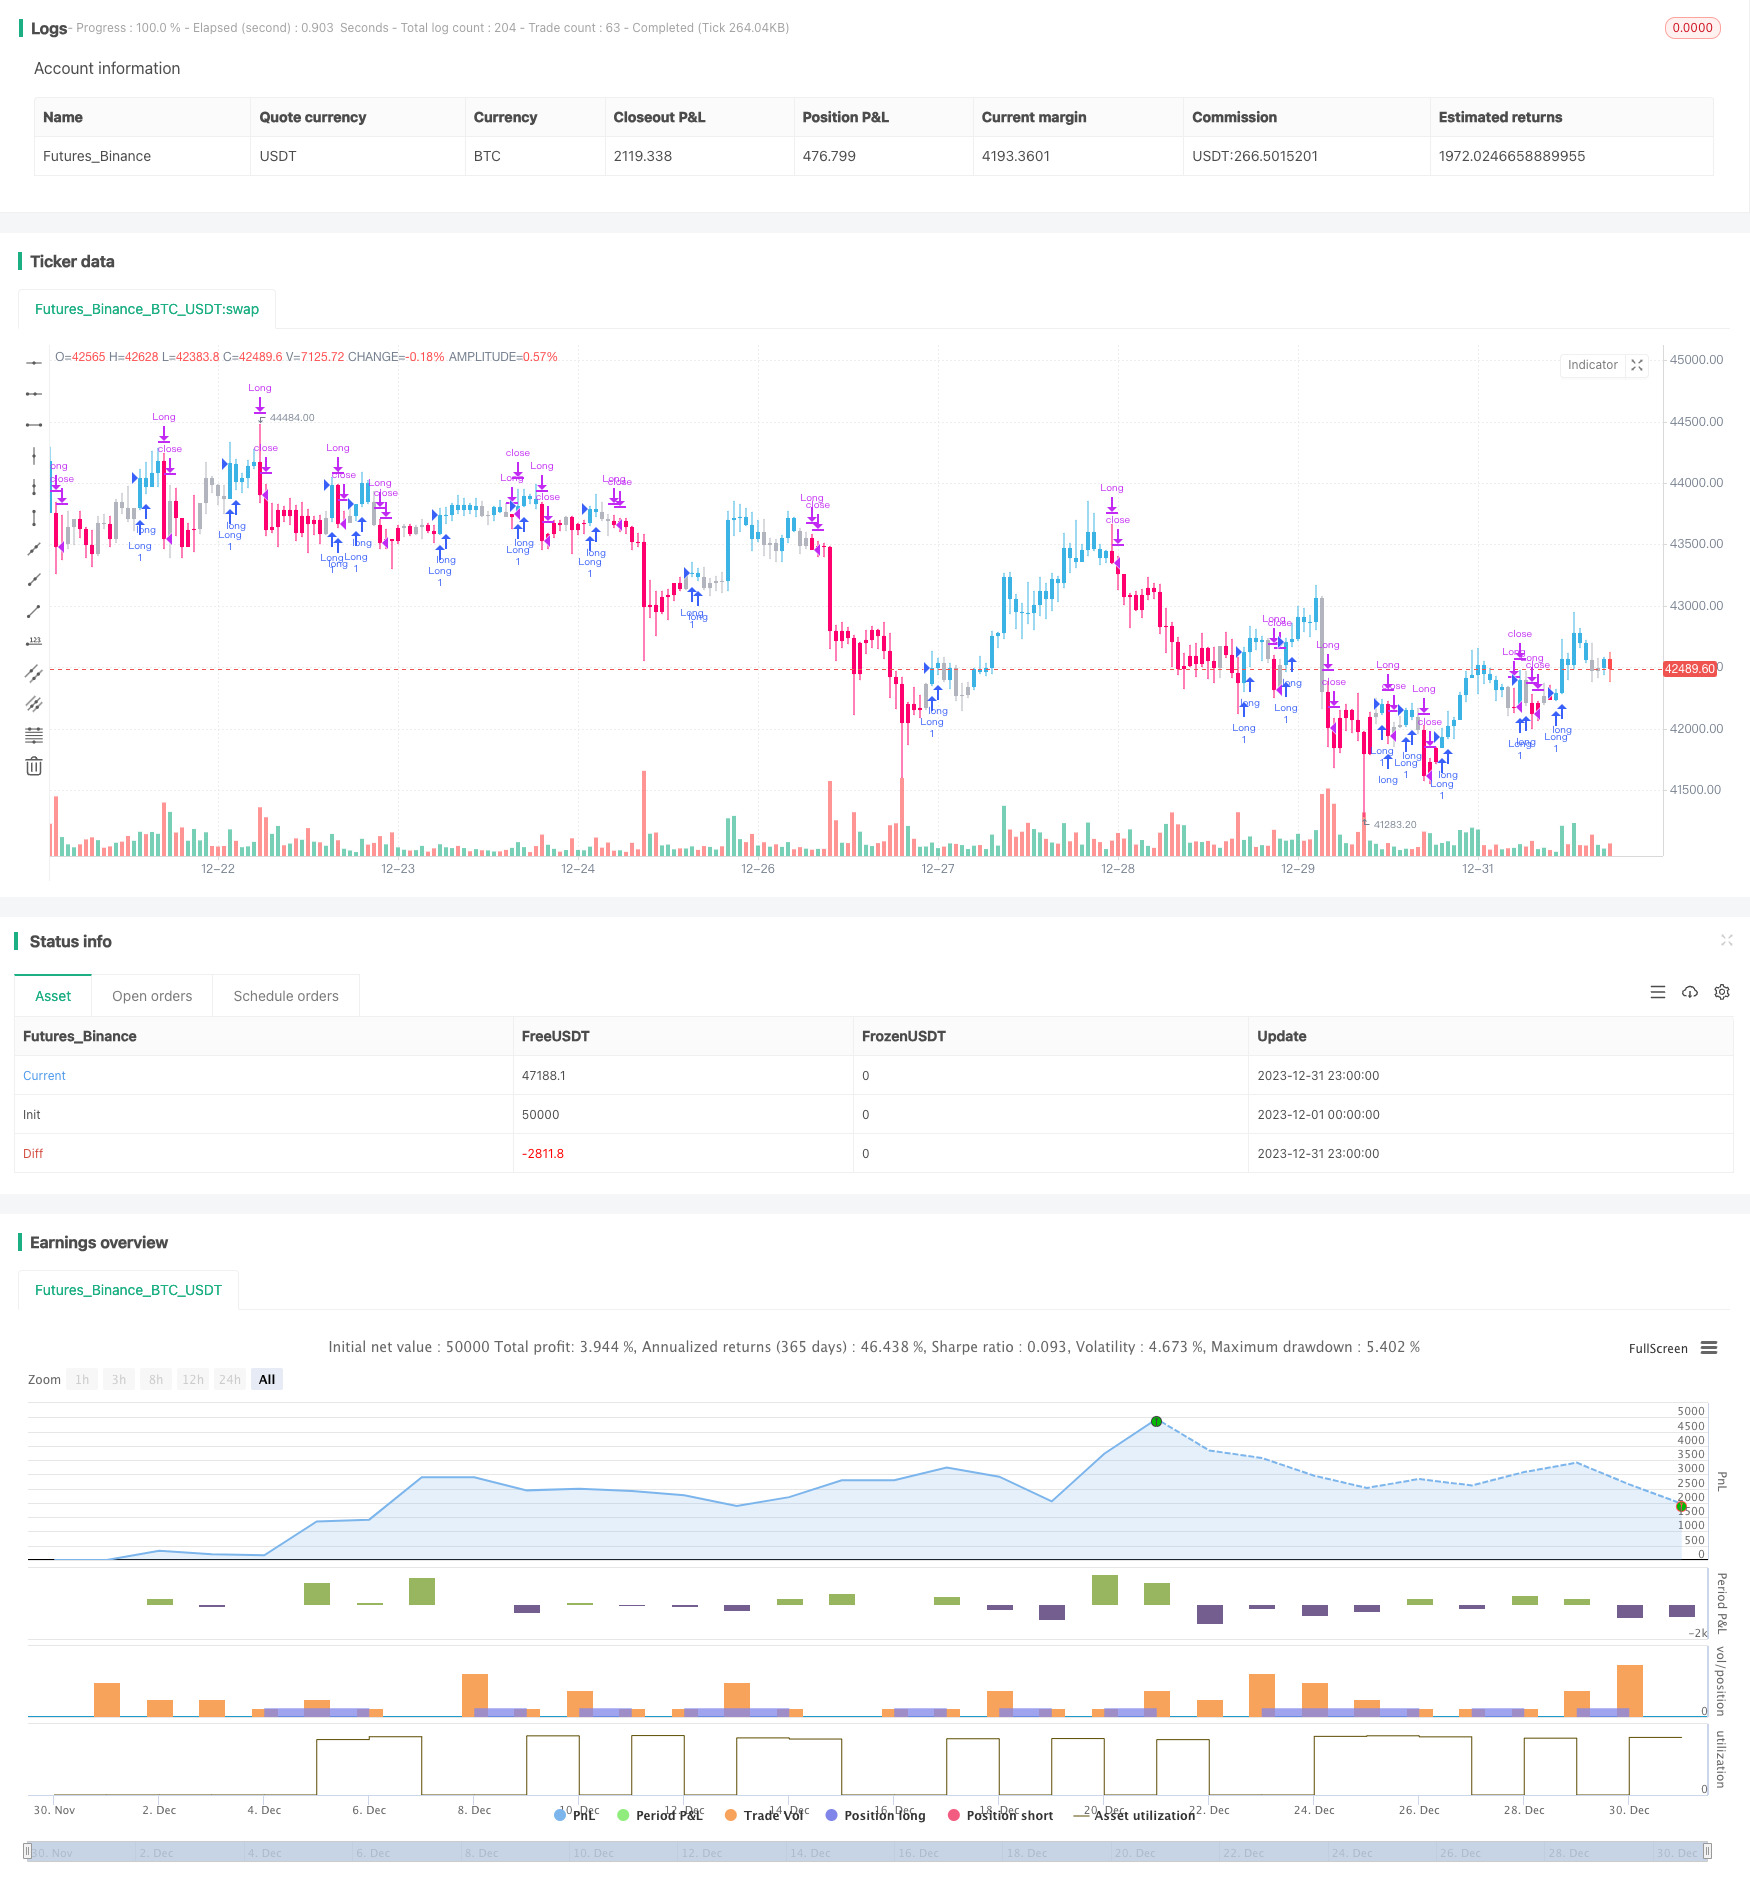
真の相対的動き MA 移動平均戦略

概要
真の相対運動MA平均線戦略 (TRMMA) は,相対的に強い指数 (RSI) と真の強い指数 (TSI) を組み合わせたトレンド追跡戦略である. RSIとTSIの指標を買い売りシグナルとして利用し,移動平均線を補助して戦略の最適化を行う.
戦略原則
この戦略は以下の部分に構成されています.
TSI計算について 価格変化率の指数平滑値を二次指数平滑で計算し,価格変化率の絶対値で指数平滑値を除くと,TSI指数が得られる。このうち長期は25日,短期は5日,信号線は14日。
RSI計算について RSIインジケータの長さは5で,終了価格を価格入力として使用します.
信号判断 TSIが信号線を上越し,RSIが50を超えると買信となる. TSIが信号線を下越し,RSIが50を超えると売信となる.
Kラインの色 信号判断によるK線染色,補助判断.
戦略パラメータ ポジション比率と資金などのパラメータを設定します.
優位分析
この戦略は,TSIとRSIの2つの指標を組み合わせて,市場動向とオーバーバイオーバーセルの状況を効果的に判断し,取引信号を生成します.TSIまたはRSIを単独で使用するよりも,偽の信号をフィルターすることができます.また,この戦略は,デフォルトのパラメータと比較して,TSIとRSIのパラメータをより激進的に設定し,より早く,高品質の取引信号を得ることができます.
リスク分析
この戦略には以下のリスクがあります.
パラメータ最適化リスク 異なる市場,異なる品種,異なる周期において,TSIとRSIの最適なパラメータは異なる可能性があり,特定の状況に合わせて最適化する必要がある.
トレンド反転リスク.戦略はそれ自体がトレンドに焦点を当てており,突然の出来事が短期的な調整または中長期のトレンド反転を引き起こした場合,戦略は大きな損失に直面する.
信号の頻度 リスク ⇒ この戦略は,デフォルトのパラメータと比較してより激進的なパラメータ設定を採用し,より頻繁な取引シグナルを生成し,取引コストと実現の難易度が高くなる可能性があります.
最適化の方向
この戦略は以下の点で最適化できます.
移動平均線などの指標を組み合わせて,信号をさらにフィルタリングして,頻繁に取引する問題を軽減します.
TSIとRSIのパラメータの最適な組み合わせを異なる市場と品種でテストし,最適なパラメータ設定を探します.
単一損失のリスクをコントロールするために,損失を抑える戦略を追加する.
ポジション管理を最適化し,トレンドが強くなるとポジションを大きくし,トレンドが弱くなるとポジションを小さくする.
要約する
TRMMA戦略は,TSIとRSIの指標を組み合わせて,買い物や売却のタイミングを判断し,トレンドを捉える強力な能力を持っています.TSIまたはRSIを単独で使用するよりも,偽の信号を効果的にフィルタリングできます.パラメータ最適化,ストップ・ロスの戦略,ポジション管理などの方法によって戦略の安定性をさらに強化できます.この戦略は,一定の量的な基盤を持つ高収益を求める投資家に適しています.
/*backtest
start: 2023-12-01 00:00:00
end: 2023-12-31 23:59:59
period: 1h
basePeriod: 15m
exchanges: [{"eid":"Futures_Binance","currency":"BTC_USDT"}]
*/

// "True relative Movement" or "TRM" for short is a system that combines my two favorite indicators: RSI and TSI. I strived to put together an indicator that combined the best of both
// in order to help discretionary traders predict market direction, weakness and strength. As with most technical indicators there are "Buy and sell" signals. Similiar to Elder Impulse system,
///TRM paints bars 3 different colors to display 3 different conditions: Blue for "Buy", Pink for "Sell", and gray for "Take profit/Hold". When the bars turn blue, that means all conditions
/// have been met. When they turn pink, no conditions have been met. When they are gray, only one condition has been met. The system is simple, yet effective. A buy signal is prodcued when
/// TSI is above the signal line, and RSI is above 50, and vice versa for sell signals. I have modified the default parameters for TSI and RSI for more "aggressive" entries and exits. I may later on
/// name this condition "Fast-TRM" and "Slow-TRM" for when default settings for TSI and RSI are applies, as this is a very robust system as well.

///******ES 1HR, 15MIN/5MIN SYSTEM***** Go long, when all time frame on a buy signal and vice versa. Take profit when the 5 min chart flips to buy or sell depending on what side of the trade you are on. Close or flip
//// long/short when time all time frames flip to Buy/Hold if short and Sell/Hold if long. Use 20EMA for additional confirmation.

//@version=4
strategy("TKP-TRM Strategy", overlay=true)
Note = input( 0, title = "TSI standard values are 25, 13, 13, and RSI is 14. Can change the default values to these for 'Slow TRM'")
long = input(title="TSI-Long Length", type=input.integer, defval=25)
short = input(title="TSI-Short Length", type=input.integer, defval=5)
signal = input(title="TSI-Signal Length", type=input.integer, defval=14)
price = close
double_smooth(src, long, short) =>
    fist_smooth = ema(src, long)
    ema(fist_smooth, short)
pc = change(price)
double_smoothed_pc = double_smooth(pc, long, short)
double_smoothed_abs_pc = double_smooth(abs(pc), long, short)
tsi_value = 100 * (double_smoothed_pc / double_smoothed_abs_pc)
TSI_Signal_Line = (ema(tsi_value, signal))


/////////////////////////////RSI////////////////////////////////////////////////

src = close, len = input(5, minval=1, title="RSILength")
up = rma(max(change(src), 0), len)
down = rma(-min(change(src), 0), len)
rsi = down == 0 ? 100 : up == 0 ? 0 : 100 - (100 / (1 + up / down))
rsiBuyfilterlevel = input(50, minval = 1, title = "RSI cross above Buy Level")
rsiSellfilterlevel = input(50, minval = 1, title = "RSI cross below Sell Level")

////////////////////////////Bar Coloring//////////////////////////////////////////////////////////

TRM_Buy = ((tsi_value > TSI_Signal_Line) and (rsi > rsiBuyfilterlevel))
TRM_Sell = ( (tsi_value < TSI_Signal_Line) and (rsi <rsiSellfilterlevel))
TRM_Color = TRM_Buy? #3BB3E4 : TRM_Sell? #FF006E : #b2b5be
barcolor(TRM_Color)


///////////////////////////Strategy Paramters////////////////////////////////////////

if (TRM_Buy)
    strategy.entry("Long", strategy.long, comment="Long")

if (TRM_Sell)
    strategy.close("Long", comment="Sell")