モメンタムブレイクアウトとエングルフィングモデルアルゴリズム取引戦略
概要
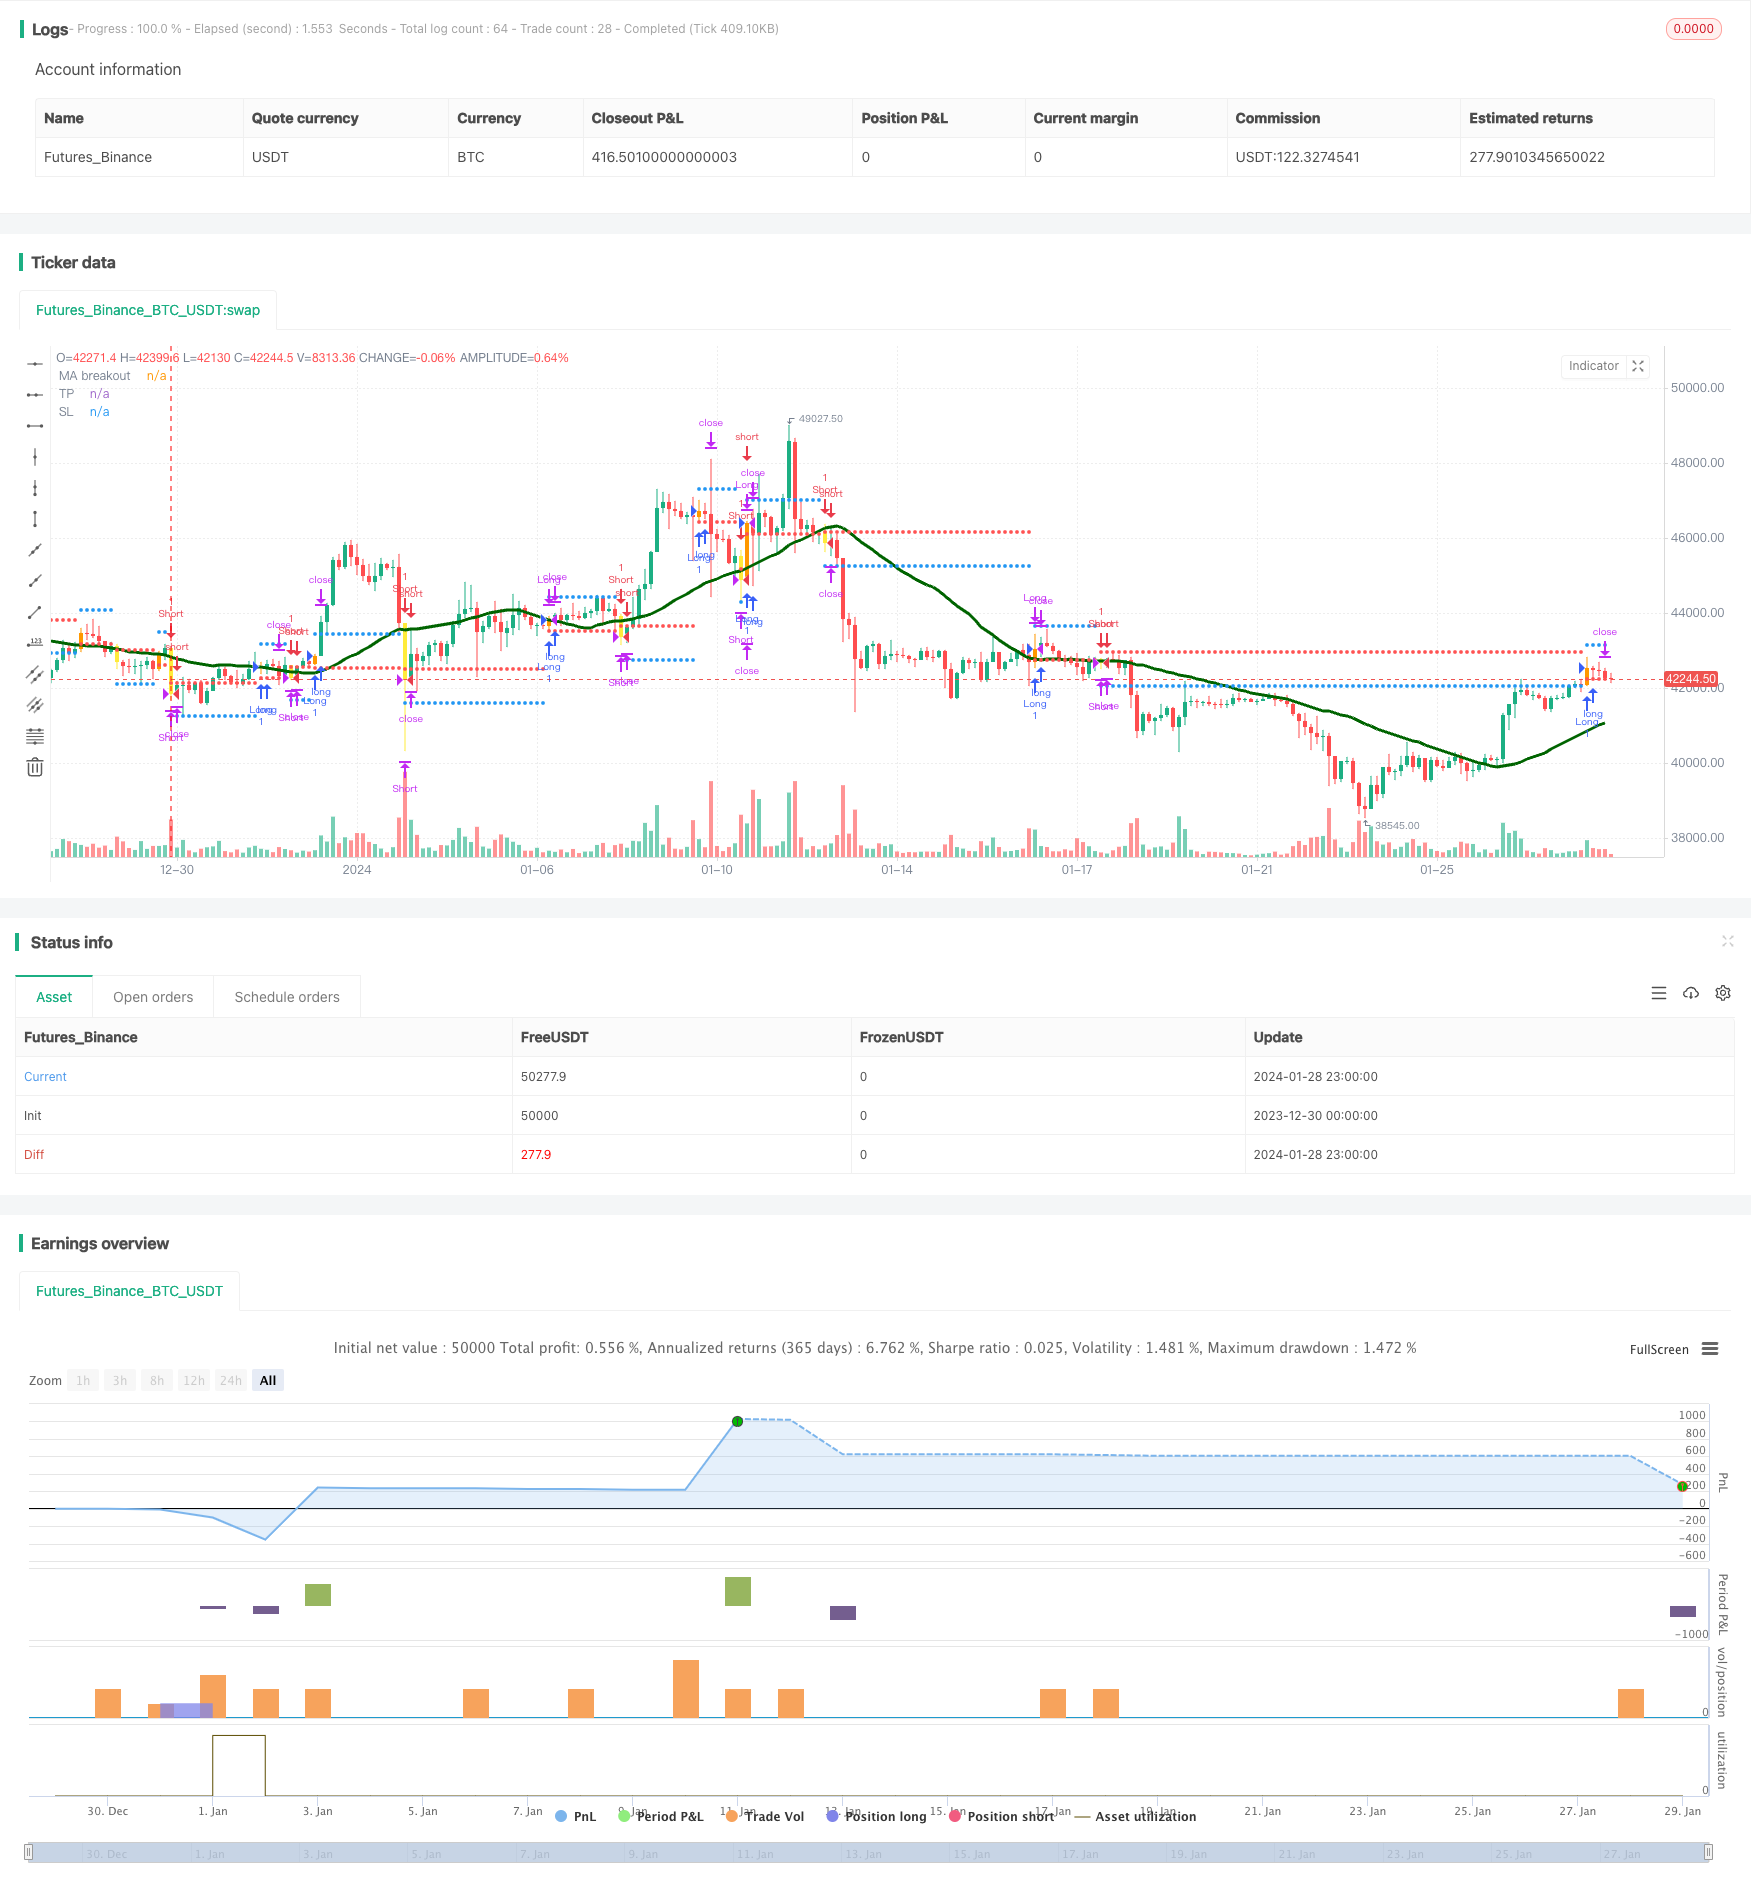
この記事では,利益の機会を識別し,価格と移動平均の交差を入場シグナルとして使用するアルゴリズム取引戦略を紹介する.この戦略は,価格の技術分析とトレンド追跡の方法を組み合わせて,トレンドの逆転点を集積し,利益を得ることを目的としている.
原則
この戦略の核心的な論理は,関連のない2つの指標の融合に基づいています.
吞食形態:二本のK線の反転パターンで,第2のK線の実体は,第1のK線の実体を完全に吞食し,反転の機会を識別する.
価格と移動平均線の交差:価格が移動平均線の下から交差移動平均線を突破すると,買取シグナルが生じます.価格が移動平均線上から交差移動平均線を突破すると,売り込みシグナルが生じます.
市場が反転する可能性があるタイミングを,食形によって判断し,価格と移動平均の横断を,反転を決定するフィルター信号として組み合わせることで,利益の確率を高めることができる.
具体的には,この戦略は,3つの吞食形態 (多頭吞食,空頭吞食,無線吞食) を追跡することで,収束と逆転の可能性を判断する.そして,価格と移動平均の金叉と死叉の信号をフィルタリングして,最終的に取引の方向を決定する.
利点
この戦略の最大の利点は,非関連指標の融合を活用して意思決定の効果を向上させることである.吞食形態は,市場の逆転のタイミングと確率を判断し,価格と移動平均を交差して逆転の方向と強さを検証する.両者は相互検証し,偽信号による取引損失を効果的に軽減する.
もう1つの優点は,パラメータ設定の柔軟性である. ユーザーは,移動平均周期,ストップダスト幅などのパラメータを自分で設定して,戦略を最適化することができる.
リスク
複数の指標を利用して判断力を高めるにもかかわらず,この戦略には一定の偽信号のリスクが残っている. 吞食形態は100%信頼性の高い反転信号ではないし,価格と移動平均の交差が効かない場合もある. これらは,超前開設の損失を引き起こす可能性がある.
さらに,ほとんどの技術分析策略と同様に,この策略は,価格の変動などの衝突の状況で市場を整えるのに劣る.継続的な変動は,ストップロスを引き起こすか,利益の余地を縮める可能性があります.
リスクを制御するために,移動平均のパラメータを適切に調整して,ストップ・ローズ幅を最適化することができる.また,他の指標と組み合わせて,トレンドと震動状況を認識し,動態調整戦略の関与の程度を考慮することもできる.
最適化の方向
この戦略は,以下の方法で最適化できます.
より多くの種類の移動平均をテストし,最適なパラメータの組み合わせを探します.例えば,加重移動平均,移動平均の順次平滑などです.
ADX,ブリン帯など.
ストップを最適化し,ストップ効果を向上させる.ストップを追跡する,Chandelier Exitなどのストップ戦略を考慮する.
K線形を判断する機械学習の方法の追加,吞食認識の正確性の向上.
自動パラメータ最適化機能を追加し,パラメータ自在適応を実現する.
要約する
本策は,形状判断反転時を食い込み,価格と移動平均の交差で反転方向を検証する.指標融合により意思決定効果を高める技術分析策である.指標が互補し,パラメータが柔軟であることの利点;欠点は,偽信号のリスクが依然としてあり,振動情勢に弱いことである.移動平均パラメータ,止損方法,トレンド判断などの方法を最適化することによって,戦略効果をさらに強化することができる.
/*backtest
start: 2023-12-30 00:00:00
end: 2024-01-29 00:00:00
period: 3h
basePeriod: 15m
exchanges: [{"eid":"Futures_Binance","currency":"BTC_USDT"}]
*/

//@version=4
//@author=Daveatt

StrategyName = "BEST Engulfing + MA"
ShortStrategyName = "BEST Engulfing + MA"

strategy(title=StrategyName, shorttitle=ShortStrategyName, overlay=true)

includeEngulfing = true

includeMA = true
source_ma = input(title="Source Price vs MA", type=input.source, defval=close)
typeofMA = input(title="Type of MA", defval="SMA", options=["RMA", "SMA", "EMA", "WMA", "VWMA", "SMMA", "KMA", "TMA", "HullMA", "DEMA", "TEMA"])
length_ma = input(32, title = "MA Length", type=input.integer)

// ---------- Candle components and states
GreenCandle = close > open
RedCandle = close < open
NoBody = close==open
Body = abs(close-open)


// bullish conditions
isBullishEngulfing1 = max(close[1],open[1]) < max(close,open) and min(close[1],open[1]) > min(close,open) and Body > Body[1] and GreenCandle and RedCandle[1]
isBullishEngulfing2 = max(close[1],open[1]) < max(close,open) and min(close[1],open[1]) <= min(close,open) and Body > Body[1] and GreenCandle and RedCandle[1]

// bearish conditions
isBearishEngulfing1 = max(close[1],open[1]) < max(close,open) and min(close[1],open[1]) > min(close,open) and Body > Body[1] and RedCandle and GreenCandle[1]
isBearishEngulfing2 = max(close[1],open[1]) >= max(close,open) and min(close[1],open[1]) > min(close,open) and Body > Body[1] and RedCandle and GreenCandle[1]

// consolidation of conditions
isBullishEngulfing = isBullishEngulfing1 or isBullishEngulfing2
isBearishEngulfing = isBearishEngulfing1 or isBearishEngulfing2

//isBullishEngulfing = max(close[1],open[1]) < max(close,open) and min(close[1],open[1]) > min(close,open) and Body > Body[1] and GreenCandle and RedCandle[1]
//isBearishEngulfing = max(close[1],open[1]) < max(close,open) and min(close[1],open[1]) > min(close,open) and Body > Body[1] and RedCandle and GreenCandle[1]

Engulf_curr = 0 - barssince(isBearishEngulfing) + barssince(isBullishEngulfing)
Engulf_Buy = Engulf_curr < 0 ? 1 : 0
Engulf_Sell = Engulf_curr > 0 ? 1 : 0


// Price vs MM


smma(src, len) =>
    smma = 0.0
    smma := na(smma[1]) ? sma(src, len) : (smma[1] * (len - 1) + src) / len
    smma

ma(smoothing, src, length) =>
    if smoothing == "RMA"
        rma(src, length)
    else
        if smoothing == "SMA"
            sma(src, length)
        else
            if smoothing == "EMA"
                ema(src, length)
            else
                if smoothing == "WMA"
                    wma(src, length)
				else
					if smoothing == "VWMA"
						vwma(src, length)
					else
						if smoothing == "SMMA"
						    smma(src, length)
						else
							if smoothing == "HullMA"
								wma(2 * wma(src, length / 2) - wma(src, length), round(sqrt(length)))
							else
								if smoothing == "LSMA"
									src
								else
								    if smoothing == "KMA"
								        xPrice = src
                                        xvnoise = abs(xPrice - xPrice[1])
                                        nfastend = 0.666
                                        nslowend = 0.0645
                                        nsignal = abs(xPrice - xPrice[length])
                                        nnoise = sum(xvnoise, length)
                                        nefratio = iff(nnoise != 0, nsignal / nnoise, 0)
                                        nsmooth = pow(nefratio * (nfastend - nslowend) + nslowend, 2)
                                        nAMA = 0.0
                                        nAMA := nz(nAMA[1]) + nsmooth * (xPrice - nz(nAMA[1]))
                                        nAMA
								    else
								        if smoothing == "TMA"
									        sma(sma(close, length), length)
						                else
							                if smoothing == "DEMA"
							                    2 * src - ema(src, length)
							                else
							                    if smoothing == "TEMA"
							                        3 * (src - ema(src, length)) + ema(ema(src, length), length)
							                    else
		    							            src


MA = ma(typeofMA, source_ma, length_ma)

plot(MA, color=#006400FF, title="MA breakout", linewidth=3)

macrossover  = crossover (source_ma, MA)
macrossunder = crossunder(source_ma, MA)

since_ma_buy = barssince(macrossover)
since_ma_sell = barssince(macrossunder)
macross_curr = 0 - since_ma_sell + since_ma_buy
bullish_MA_cond = macross_curr < 0 ?  1 : 0
bearish_MA_cond = macross_curr > 0 ? 1  : 0

posUp = (Engulf_Buy ? 1 : 0) + (bullish_MA_cond ? 1 : 0)
posDn = (Engulf_Sell ? 1 : 0) + (bearish_MA_cond ? 1 : 0)

conditionUP = posUp == 2 and posUp[1] < 2
conditionDN = posDn == 2 and posDn[1] < 2


sinceUP = barssince(conditionUP)
sinceDN = barssince(conditionDN)

// primary-first signal of the trend
nUP = crossunder(sinceUP,sinceDN)
nDN = crossover(sinceUP,sinceDN)


// and the following secondary signals

// save of the primary signal
sinceNUP = barssince(nUP)
sinceNDN = barssince(nDN)

buy_trend   = sinceNDN > sinceNUP
sell_trend  = sinceNDN < sinceNUP

// engulfing by
barcolor(nUP ? color.orange : na, title="Bullish condition")
barcolor(nDN ? color.yellow : na, title="Bearish condition")

isLong  = nUP
isShort = nDN

long_entry_price    = valuewhen(nUP, close, 0)
short_entry_price   = valuewhen(nDN, close, 0)

longClose   = close[1] < MA
shortClose  = close[1] > MA

///////////////////////////////////////////////
//* Backtesting Period Selector | Component *//
///////////////////////////////////////////////


StartYear = input(2017, "Backtest Start Year",minval=1980)
StartMonth = input(1, "Backtest Start Month",minval=1,maxval=12)
StartDay = input(1, "Backtest Start Day",minval=1,maxval=31)
testPeriodStart = timestamp(StartYear,StartMonth,StartDay,0,0)

StopYear = input(2020, "Backtest Stop Year",minval=1980)
StopMonth = input(12, "Backtest Stop Month",minval=1,maxval=12)
StopDay = input(31, "Backtest Stop Day",minval=1,maxval=31)
testPeriodStop = timestamp(StopYear,StopMonth,StopDay,0,0)

testPeriod() => true


//////////////////////////
//* Profit Component *//
//////////////////////////

input_tp_pips = input(600, "Backtest Profit Goal (in USD)",minval=0)
input_sl_pips = input(300, "Backtest STOP Goal (in USD)",minval=0)


tp = buy_trend? long_entry_price + input_tp_pips : short_entry_price - input_tp_pips
sl = buy_trend? long_entry_price - input_sl_pips : short_entry_price + input_sl_pips


long_TP_exit  = buy_trend and high >= tp
short_TP_exit = sell_trend and low <= tp

plot(tp, title="TP", style=plot.style_circles, linewidth=3, color=color.blue)
plot(sl, title="SL", style=plot.style_circles, linewidth=3, color=color.red)

if testPeriod()
    strategy.entry("Long", 1, when=isLong)
    strategy.close("Long", when=longClose )
    strategy.exit("XL","Long", limit=tp,  when=buy_trend, stop=sl)


if testPeriod()
    strategy.entry("Short", 0,  when=isShort)
    strategy.close("Short", when=shortClose )
    strategy.exit("XS","Short", when=sell_trend, limit=tp, stop=sl)