一目均衡表エントリー戦略
概要
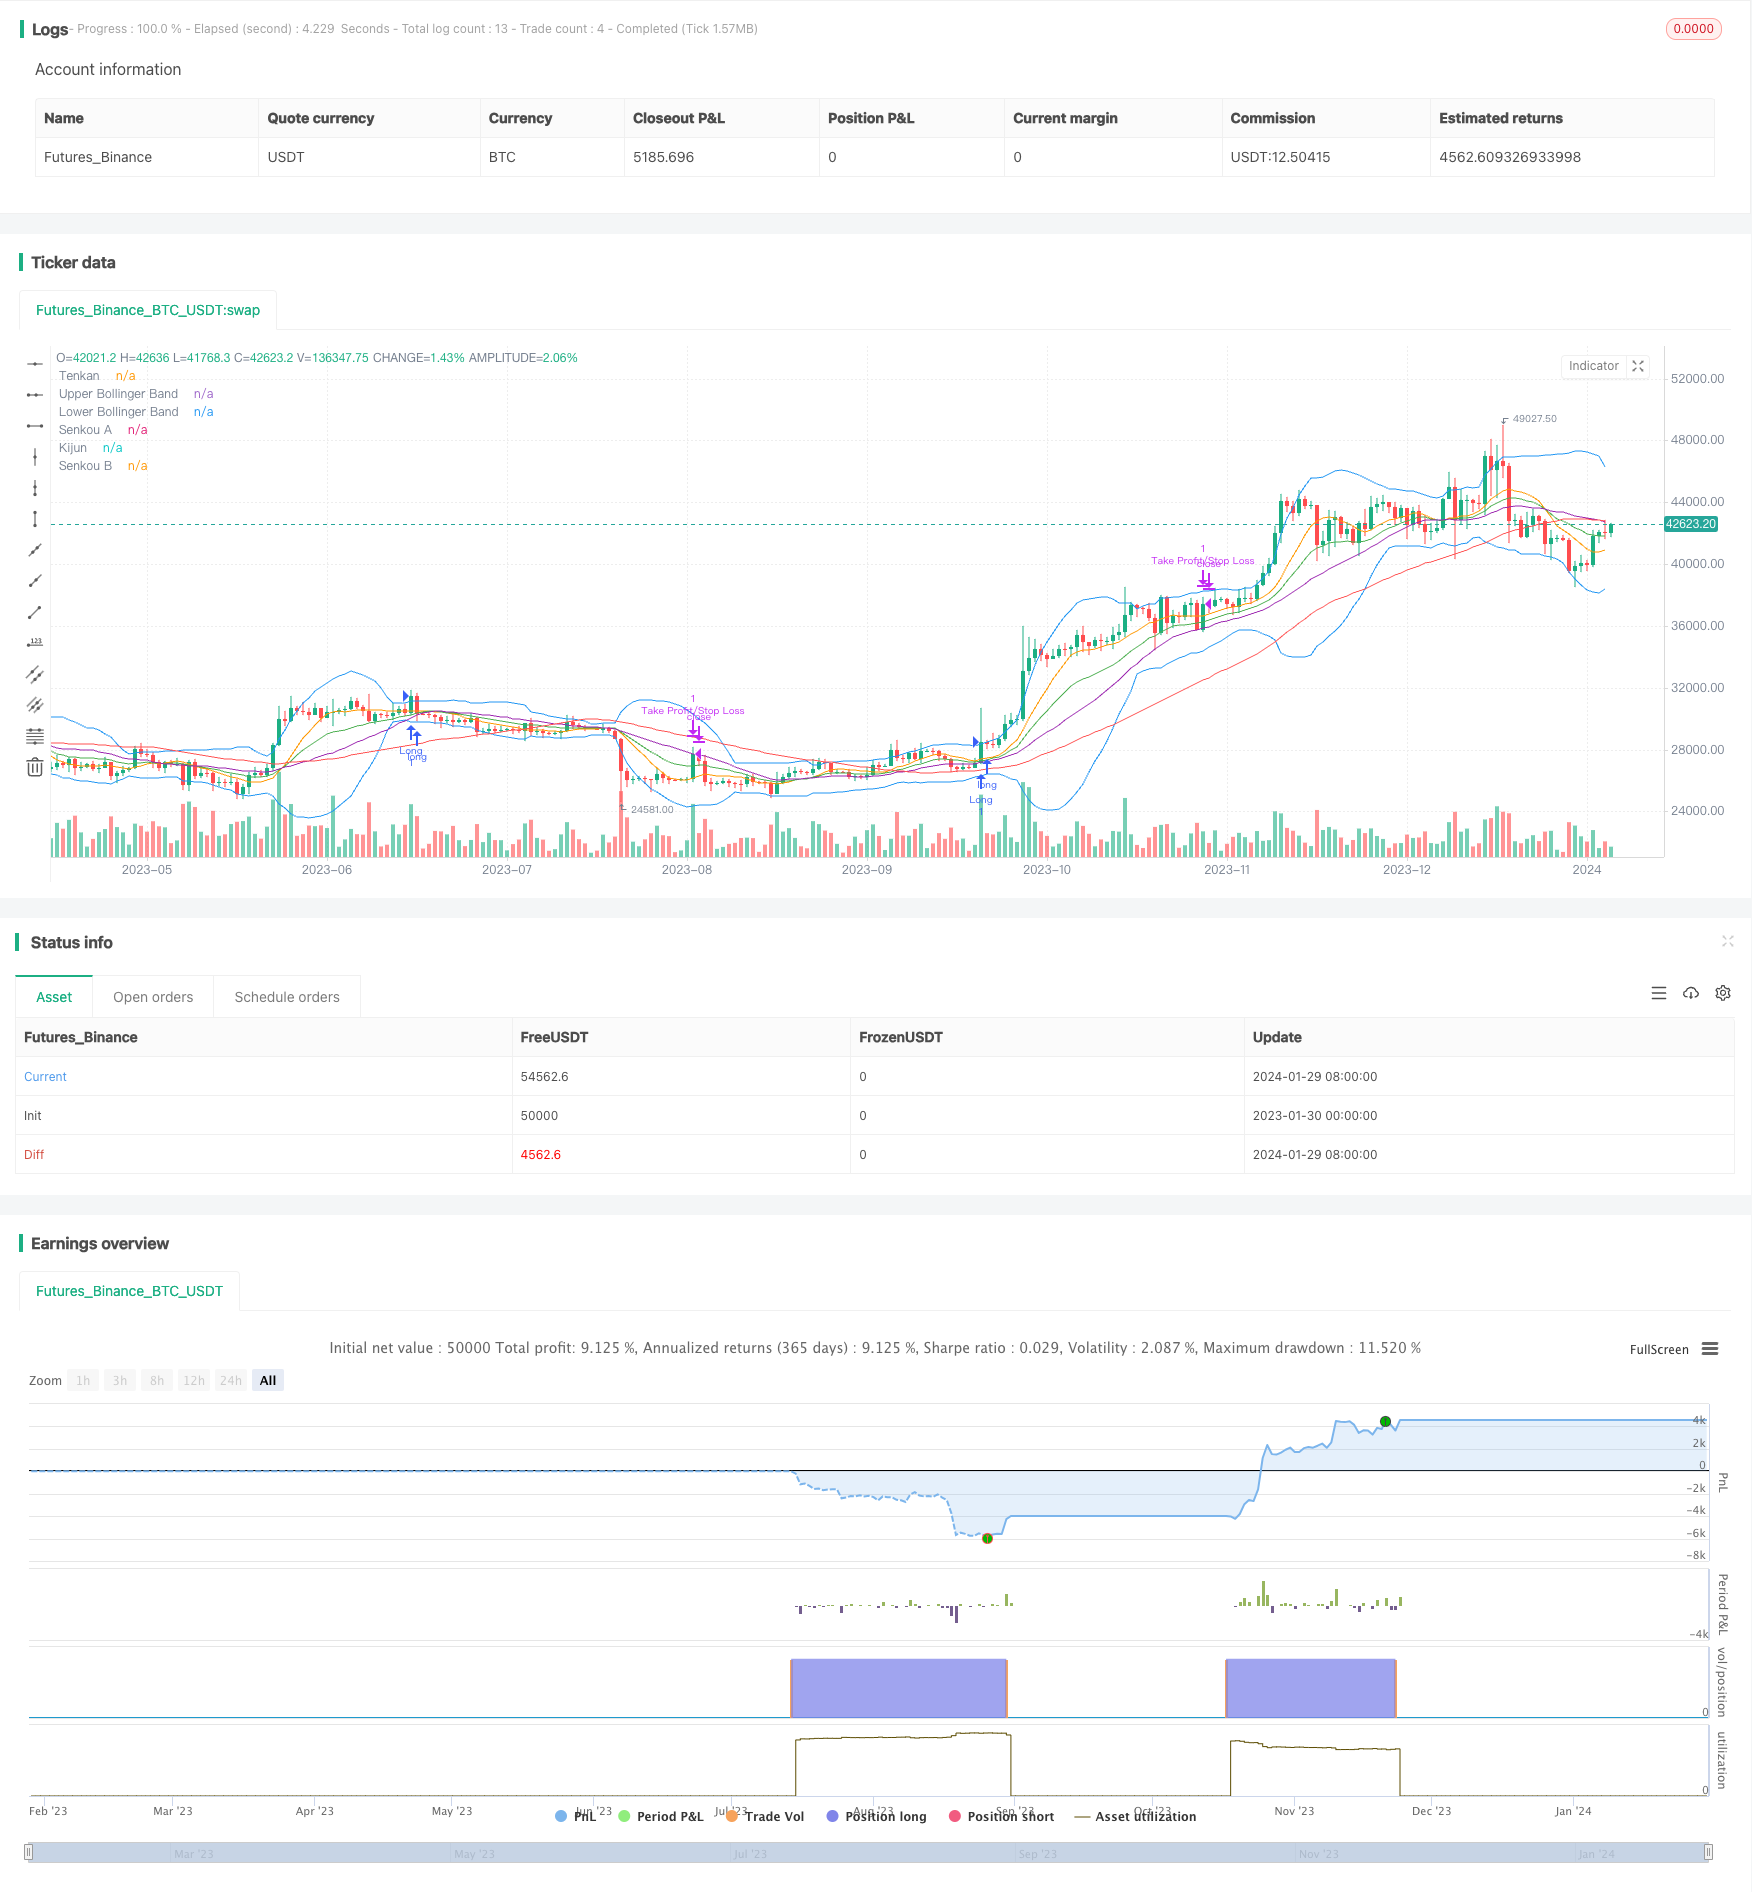
Ichimoku Entriesは,Ichimoku Cloud Graph指標を使用してトレンドの方向性を認識し,ブリン帯,RSI指標と組み合わせて取引信号を発する量化戦略である.この戦略は,主に,十回線とベースラインの金叉死叉に基づいて,現在多頭市場か空頭市場にあるかを判断し,長ポジションと短ポジションの入場信号を生成する.
戦略原則
この戦略は,イチモク雲図の2つの重要な線である10回転線と基線を主に利用する. 10回転線は,最近の9日の最高値と最低値の平均値であり,短期的なトレンドを表す. 基線は,最近の26日の最高値と最低価格の平均値であり,中長期的なトレンドを表す. 短期線10回転線上を通る中長期線基線上を通る時,入場を代表する多し; 10回転線下を通る時,入場を代表する空きを代表する. このように,現在のトレンドの方向を判断する.
イチモク雲図に加えて,戦略はブリン帯とRSI指標を検出して取引信号を発出する. 閉盘価格がブリン帯を突破して上線または下線したときにのみ,価格が異常であることを示す. 同時に,RSI指標と組み合わせて,超買い超売り領域にあるかどうかを判断し,部分的な偽の突破をフィルターして,入場信号を生成する.
退出の論理上,戦略はブリン帯の突破が成功するか否か,取引雰囲気指標TPOがゼロ軸の横断が起こったか否かを判断し,利益または損失の退出を決定する.
優位分析
この戦略の最大の利点は,トレンド判断と異常波動を同時に利用して取引の方向を決定することです.イチモク雲図はトレンドを明確に判断し,ブリン帯は異常波動を捉えます.RSI指標は偽突破を効果的にフィルタリングできます.複数の指標の配合を使用することで,取引信号がより信頼性が高くなります.さらに,戦略は,止損と停止ロジックを加え,利益をロックし,巨額の損失を避けることができます.
リスク分析
トレンドと異常波動を識別する利点があるにもかかわらず,この戦略には一定のリスクがあります.トレンドを追跡するので,波動的な状況で偽信号が多く発生する可能性があります.また,パラメータの設定が不適切であることも戦略のパフォーマンスに影響を与えます.異なるパラメータの組み合わせをテストし,最適なパラメータを決定するために,ステップアップ最適化方法を採用することをお勧めします.
最適化の方向
この戦略は以下の点で最適化できます.
- ブリン帯天数,RSI天数などの異なるパラメータの組み合わせをテストする.
- 機械学習アルゴリズムを追加し,歴史データ訓練モデルに基づいて動的出力パラメータを追加する.
- 市場情勢を判断し,重要な時に間違った決断をしないようにする.
- 価格の動きに伴いストップを増加させ,利益を維持する.
要約する
Ichimoku Entries戦略は,多指標融合のトレンド追跡戦略である. 傾向の方向と価格の異常を判断しながら,比較的に信頼できる市場リズムを把握する. 改善の余地があるが,全体的に安定したパフォーマンス,リスクが制御可能な量化取引戦略である. 参数最適化と機械学習の導入は,戦略の効果をさらに優れたものにすることができる.
/*backtest
start: 2023-01-30 00:00:00
end: 2024-01-30 00:00:00
period: 1d
basePeriod: 1h
exchanges: [{"eid":"Futures_Binance","currency":"BTC_USDT"}]
*/

//@version=5
strategy("ichi strategy", overlay=true)

// Input parameters
rsiLength = input(14, title="RSI Length")
bbLength = input(20, title="Bollinger Bands Length")
bbMultiplier = input(2, title="Bollinger Bands Multiplier")
stopLossPct = input(1, title="Stop Loss Percentage")
takeProfitPct = input(2, title="Take Profit Percentage")

// Calculate Ichimoku Cloud components
tenkan = ta.sma(high + low, 9) / 2
kijun = ta.sma(high + low, 26) / 2
senkouA = (tenkan + kijun) / 2
senkouB = ta.sma(high + low, 52) / 2

// Bollinger Bands
basis = ta.sma(close, bbLength)
upperBB = basis + bbMultiplier * ta.stdev(close, bbLength)
lowerBB = basis - bbMultiplier * ta.stdev(close, bbLength)

// RSI
rsiValue = ta.rsi(close, rsiLength)

// Trade Proximity Oscillator
length = input(14, title="Channels Length")
multiplier = input(2, title="Channels Multiplier")
atr_length = input(14, title="ATR Length")
threshold_percentage = input(1.5, title="Threshold Percentage (%)")

ma = ta.sma(close, length)
std_dev = ta.stdev(close, length)
upper_band = ma + multiplier * std_dev
lower_band = ma - multiplier * std_dev
distance_upper = close - upper_band
distance_lower = lower_band - close
atr_value = ta.atr(atr_length)
threshold = atr_value * threshold_percentage
oscillator = distance_upper - distance_lower

// Strategy logic
longCondition = close > upperBB and tenkan > kijun and ta.crossover(close, basis) and rsiValue < 70
shortCondition = close < lowerBB and tenkan < kijun and ta.crossunder(close, basis) and rsiValue > 30

strategy.entry("Long", strategy.long, when = longCondition)
strategy.entry("Short", strategy.short, when = shortCondition)

// Exit logic
longExitCondition = close < upperBB and ta.crossover(oscillator, 0)
shortExitCondition = close > lowerBB and ta.crossunder(oscillator, 0)

strategy.exit("Take Profit/Stop Loss", from_entry="Long", loss=close - close * stopLossPct / 100, profit=close + close * takeProfitPct / 100, when = longExitCondition)
strategy.exit("Take Profit/Stop Loss", from_entry="Short", loss=close + close * stopLossPct / 100, profit=close - close * takeProfitPct / 100, when = shortExitCondition)

// Plotting
plot(senkouA, color=color.green, title="Senkou A")
plot(senkouB, color=color.red, title="Senkou B")
plot(upperBB, color=color.blue, title="Upper Bollinger Band")
plot(lowerBB, color=color.blue, title="Lower Bollinger Band")

// Additional Plots
plot(tenkan, color=color.orange, title="Tenkan")
plot(kijun, color=color.purple, title="Kijun")