再帰ボリューム取引戦略
概要
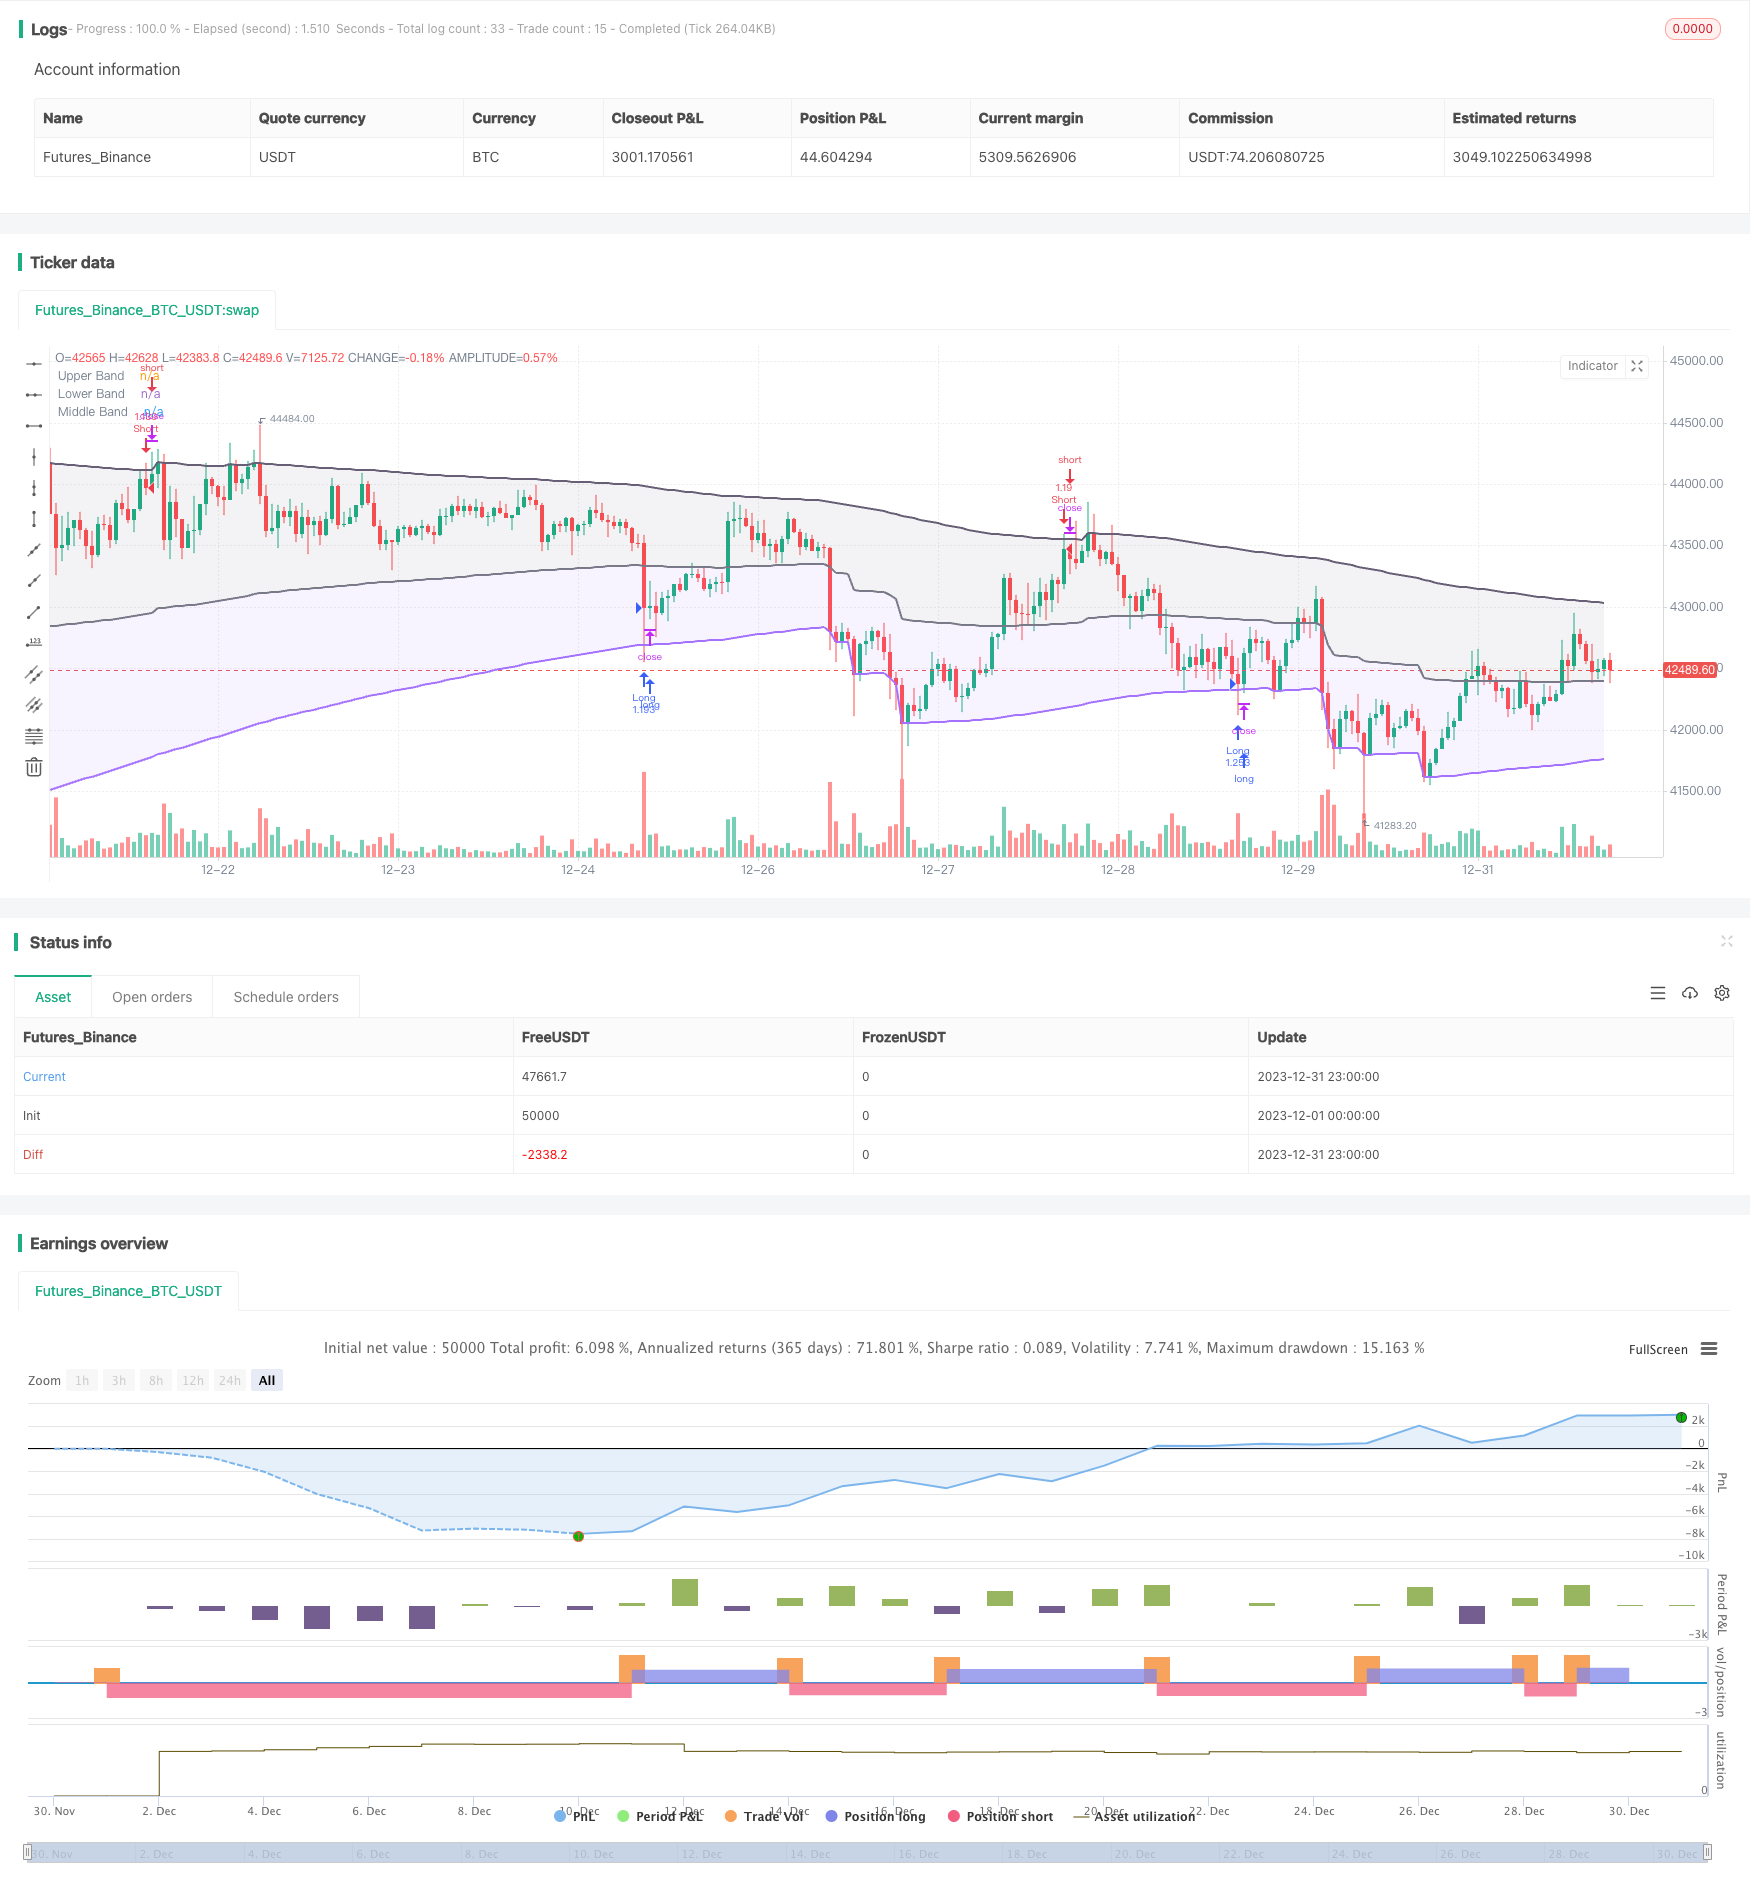
この戦略は,alexgroverが開発したレクリエント帯の指標に基づくトレンド追跡とブレークアウト戦略である.この戦略は,レクリエント帯の指標を使用して価格の傾向と重要なサポートレジスタンス値を判断し,動量条件のフィルタリング偽ブレークアウトと組み合わせて,低頻度でも高品質の入場を実現する.
戦略原則
累乗帯指数計算
リクリエーション帯の指標は上帯,下帯,中線で構成されている.指標の計算方法は:
上帯 = 最大値 ((前K線の上帯,閉店価格 + n*変動率)
下帯 = 最小値 ((前K線の下帯,閉盘価格 - n*変動率)
この線は,上線と下線の2分の1です.
nはスケーリング係数で,波動率はATR,標準差,平均値チャネル,特殊なRFV手法で選択できる.長度パラメータは指標の感度を制御し,値が大きいほど,指標は触発しやすくない.
戦略的取引のルール
戦略は,まず,下帯方向が上昇し,上帯方向が低下し続けているかどうかを検出して,偽突破を排除する.
価格が上位帯を超えると空きを取ります.
この戦略は,ストップダメージの論理を設定しています.
優位分析
この戦略の利点は以下の通りです.
- リクレーショナル・フレームワークを利用して,指標を効率的に計算し,重複計算を避ける
- 市場環境により調整可能な指標パラメータ
- 突破を回避するためにトレンドと突破を組み合わせる
- 動力条件のフィルタリングにより,取引信号の質を保証する
リスク分析
この戦略にはいくつかのリスクがあります.
- パラメータを正しく設定しない場合,取引頻度が高くなり,信号の質が悪くなる
- 大周期的なトレンドの変化により,大きな損失が発生する可能性があります.
- エクストリーム・トレード・スライド・ポイントの制御不足により,損失が拡大する可能性がある.
これらのリスクは,パラメータを最適化して,ストップを設定し,滑り点を増やすことで制御できます.
最適化の方向
この戦略は以下の方向から最適化できます.
- 複数の周期指標を組み合わせ,複数の時間枠取引を実現
- 機械学習モジュールを追加し,パラメータの自己適応最適化を実現
- 関連性分析の量化を加え,最適のパラメータの組み合わせを見つけます.
- ディープ・ラーニングにより,価格の予測の経路が改善され,信号の精度が向上します.
要約する
この戦略は,全体的に非常に実用的で効率的なトレンド追跡戦略である.これは,計算資源を節約する累乗フレームワークと組み合わせて,トレンドの方向を判断するレジスタンスをサポートするトレンドを使用し,運動条件のフィルタリングの偽突破を増加させ,取引信号の質を保証する.パラメータ調整とリスク管理の条件下では,より良い効果を得ることができる.さらに研究と最適化を行い,より複雑な市場環境に適応する価値があります.
/*backtest
start: 2023-12-01 00:00:00
end: 2023-12-31 23:59:59
period: 1h
basePeriod: 15m
exchanges: [{"eid":"Futures_Binance","currency":"BTC_USDT"}]
*/

// @version=5
// Original indicator by alexgrover
strategy('Extended Recursive Bands Strategy', overlay=true, commission_type=strategy.commission.percent,commission_value=0.06,default_qty_type =strategy.percent_of_equity,default_qty_value = 100,initial_capital =1000)
length = input.int(260, step=10, title='Length')
src = input(close, title='Source')
method = input.string('Classic', options=['Classic', 'Atr', 'Stdev', 'Ahlr', 'Rfv'], title='Method')
bandDirectionCheck = input.bool(true, title='Bands Hold Direction')
lookback = input(3)
//----
atr = ta.atr(length)
stdev = ta.stdev(src, length)
ahlr = ta.sma(high - low, length)
rfv = 0.
rfv := ta.rising(src, length) or ta.falling(src, length) ? math.abs(ta.change(src)) : rfv[1]
//-----
f(a, b, c) =>
    method == a ? b : c
v(x) =>
    f('Atr', atr, f('Stdev', stdev, f('Ahlr', ahlr, f('Rfv', rfv, x))))
//----
sc = 2 / (length + 1)
a = 0.
a := math.max(nz(a[1], src), src) - sc * v(math.abs(src - nz(a[1], src)))
b = 0.
b := math.min(nz(b[1], src), src) + sc * v(math.abs(src - nz(b[1], src)))
c = (a+b)/2

// Colors
beColor = #675F76
buColor = #a472ff

// Plots
pA = plot(a, color=color.new(beColor, 0), linewidth=2, title='Upper Band')
pB = plot(b, color=color.new(buColor, 0), linewidth=2, title='Lower Band')
pC = plot(c, color=color.rgb(120,123,134,0), linewidth=2, title='Middle Band')
fill(pC, pA, color=color.new(beColor,90))
fill(pC, pB, color=color.new(buColor,90))

// Band keeping direction
// By Adulari
longc = 0
shortc = 0
for i = 0 to lookback-1
    if b[i] > b[i+1]
        longc:=longc+1
    if a[i] < a[i+1]
        shortc:=shortc+1
bhdLong = if bandDirectionCheck
    longc==lookback
else
    true
bhdShort = if bandDirectionCheck
    shortc==lookback
else
    true

// Strategy
if b>=low and bhdLong
    strategy.entry(id='Long',direction=strategy.long)
if high>=a and bhdShort
    strategy.entry(id='Short',direction=strategy.short)

// TP at middle line
//if low<=c and strategy.position_size<0 and strategy.position_avg_price>close
    //strategy.exit(id="Short",limit=close)
//if high>=c and strategy.position_size>0 and strategy.position_avg_price<close
    //strategy.exit(id="Long",limit=close)