ダブル ATR トレーリング ストップ ロス戦略
概要
双ATR尾随ストップ戦略は,平均真波幅 ((ATR) 指数に基づくショートライン取引戦略である.この戦略は,同時に高速ATRラインと遅いATRラインの2つのストップラインを設定し,二つのストップラインの交差状況に基づいて入場と出場を判断する.戦略は,簡単で分かりやすく,迅速に反応し,高波動の市場に適している.
戦略原則
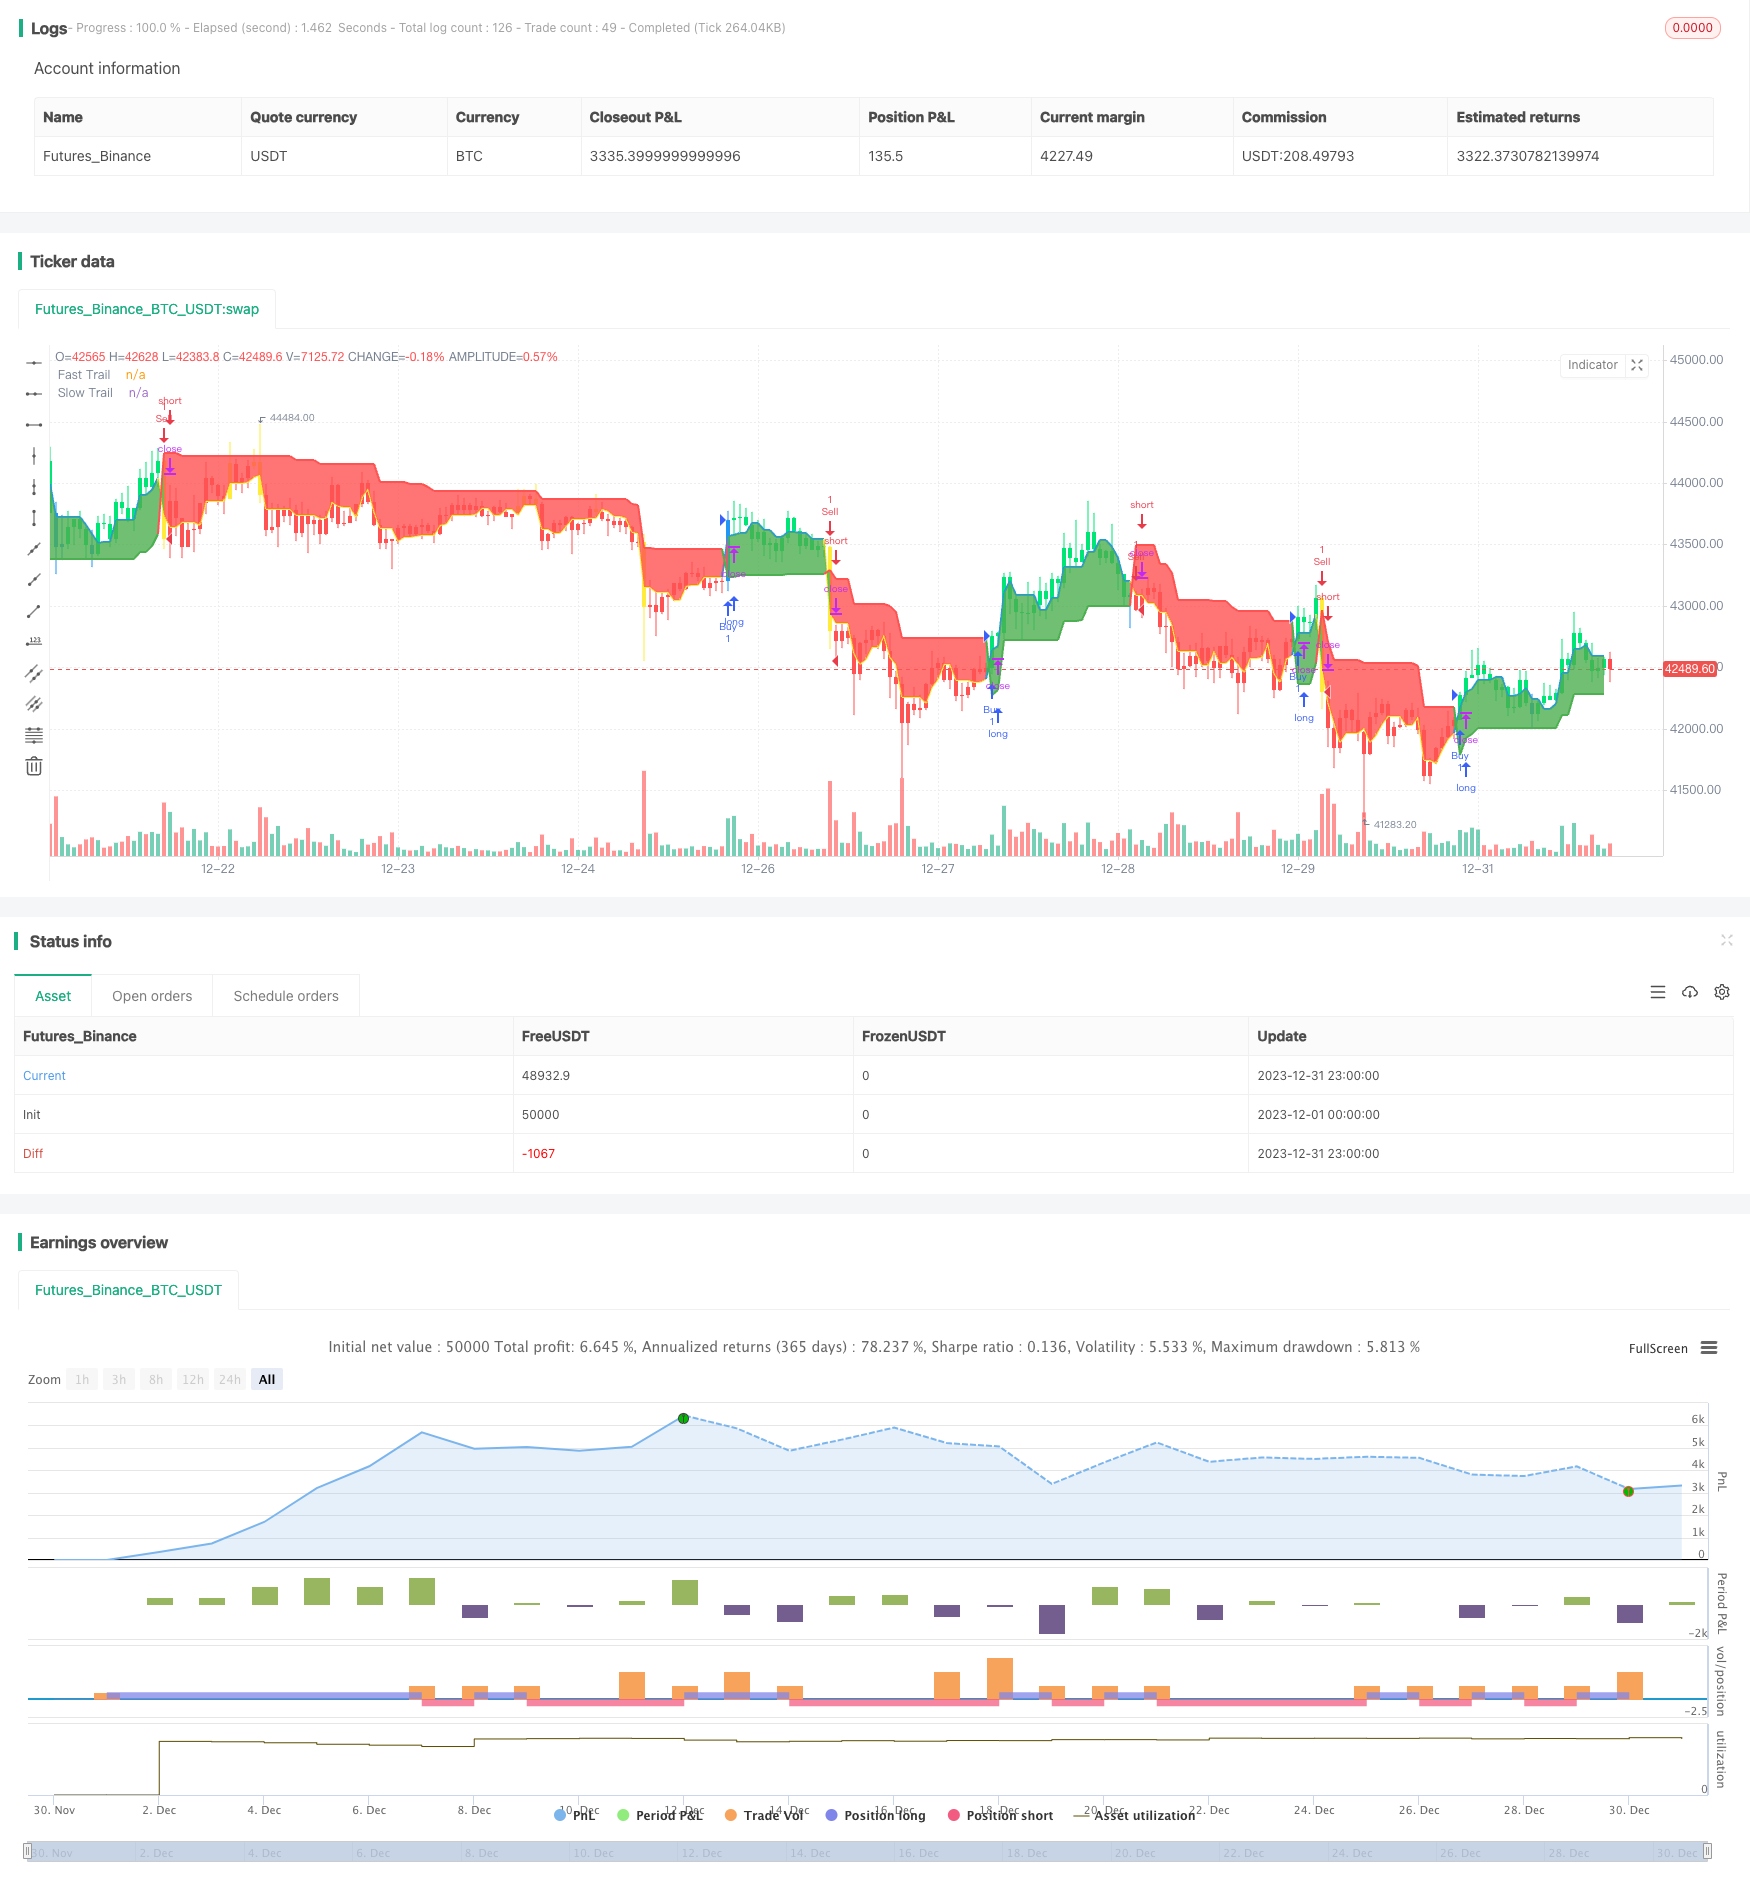
この戦略は主にATR指標を使用して2つのストップラインを設定する.一つは,ATR周期が短い,小数倍,迅速に対応する高速ATR線;もう一つは,ATR周期が長い,大数倍,フィルタリングの役割を果たす高速ATR線である.高速ATR線上の遅いATR線を横切るときに買い信号が生じる.高速ATR線の下の遅いATR線を横切るときに売り信号が生じる.このように,ATR線を2つ交差して決定場に入ると,ストップローを効果的に制御することができる.
具体的な操作の論理は,高速ATR線と遅いATR線を計算し,高速線価格が遅い線より高い場合は高速線でストップし,遅い線でストップする. クラインの色は,現在使用されているストップラインを表し,緑と青は高速線でストップし,赤と黄色は遅い線でストップする. 市場価格がストップラインに触れたときに出場する.
優位分析
双ATRの尾行ストップ戦略は以下の利点があります.
- 操作の論理はシンプルでわかりやすく,理解しやすい.
- 市場の変化に素早く反応し,波動性のある市場に適しています.
- 双ATRの止損制御リスク,有効な止損.
- ATR指標はパラメータ化されており,ストップ・ローズ幅を調整することができる.
- 視覚化されたKlineの色は,停止状態を明確に表示する.
リスク分析
この戦略にはいくつかのリスクがあります.
- 取引が頻発する傾向がある.
- ATR指標は曲線に適合性が悪く,放大損失が発生する可能性がある.
- 横軸とトレンドの2つの市場段階を効果的にフィルターすることはできません.
ATRサイクルを最適化し,ATR倍数を調整し,他の指標のフィルタリングと組み合わせる方法などにより,これらのリスクを軽減することができます.
最適化の方向
双ATR尾行ストップ戦略のさらなる最適化方向は,以下の通りです.
- ATRパラメータを最適化し,ストップ・ローズ幅を調整する.
- フィルタリング指数を増やして,無効取引を回避する.例えば,平均線指数を増やしてトレンド判断する.
- ポジション開設条件を高め,誤った取引を避ける.例えば,取引量エネルギー指数を増やす.
- 持仓時間を増やし,出口を減らし,頻繁に取引を避ける.
要約する
双ATR尾随止損策は,全体的に理解し易く実装され,特に高波動率のシナリオに適しており,リスク管理を効果的に行うことができます.最適化スペースも大きいので,パラメータ調整,フィルターを追加などの方法によって向上させることができます.推奨されるショートライン策です.
/*backtest
start: 2023-12-01 00:00:00
end: 2023-12-31 23:59:59
period: 1h
basePeriod: 15m
exchanges: [{"eid":"Futures_Binance","currency":"BTC_USDT"}]
*/

// This source code is subject to the terms of the Mozilla Public License 2.0 at https://mozilla.org/MPL/2.0/
// © ceyhun

//@version=4
strategy("ATR Trailing Stop Strategy by ceyhun", overlay=true)

/////////notes////////////////////////////////////////
// This is based on the ATR trailing stop indicator //
// width addition of two levels of stops and        //
// different interpretation.                        //
// This is a fast-reacting system and is better     //
// suited for higher volatility markets             //
//////////////////////////////////////////////////////

SC = input(close, "Source", input.source)

// Fast Trail //
AP1 = input(5, "Fast ATR period", input.integer)  // ATR Period
AF1 = input(0.5, "Fast ATR multiplier", input.float)  // ATR Factor
SL1 = AF1 * atr(AP1)  // Stop Loss
Trail1 = 0.0
Trail1 := iff(SC > nz(Trail1[1], 0) and SC[1] > nz(Trail1[1], 0), max(nz(Trail1[1], 0), SC - SL1), iff(SC < nz(Trail1[1], 0) and SC[1] < nz(Trail1[1], 0), min(nz(Trail1[1], 0), SC + SL1), iff(SC > nz(Trail1[1], 0), SC - SL1, SC + SL1)))

// Slow Trail //
AP2 = input(10, "Slow ATR perod", input.integer)  // ATR Period
AF2 = input(2, "Slow ATR multiplier", input.float)  // ATR Factor
SL2 = AF2 * atr(AP2)  // Stop Loss
Trail2 = 0.0
Trail2 := iff(SC > nz(Trail2[1], 0) and SC[1] > nz(Trail2[1], 0), max(nz(Trail2[1], 0), SC - SL2), iff(SC < nz(Trail2[1], 0) and SC[1] < nz(Trail2[1], 0), min(nz(Trail2[1], 0), SC + SL2), iff(SC > nz(Trail2[1], 0), SC - SL2, SC + SL2)))

// Bar color for trade signal //
Green = Trail1 > Trail2 and close > Trail2 and low > Trail2
Blue = Trail1 > Trail2 and close > Trail2 and low < Trail2
Red = Trail2 > Trail1 and close < Trail2 and high < Trail2
Yellow = Trail2 > Trail1 and close < Trail2 and high > Trail2

// Signals //
Bull = barssince(Green) < barssince(Red)
Bear = barssince(Red) < barssince(Green)

Buy = crossover(Trail1, Trail2)
Sell = crossunder(Trail1, Trail2)

TS1 = plot(Trail1, "Fast Trail", style=plot.style_line,color=Trail1 > Trail2 ? color.blue : color.yellow, linewidth=2)
TS2 = plot(Trail2, "Slow Trail", style=plot.style_line,color=Trail1 > Trail2 ? color.green : color.red, linewidth=2)
fill(TS1, TS2, Bull ? color.green : color.red, transp=90)

plotcolor = input(true, "Paint color on chart", input.bool)

bcl = iff(plotcolor == 1, Blue ? color.blue : Green ? color.lime : Yellow ? color.yellow : Red ? color.red : color.white, na)
barcolor(bcl)

if Buy
    strategy.entry("Buy", strategy.long, comment="Buy")

if Sell
    strategy.entry("Sell", strategy.short, comment="Sell")