時間枠をまたいだ勢い追跡戦略
概要
この戦略は,123反転とMACD指標を組み合わせて,時間枠を越えた動力の追跡を可能にします.123反転は短期トレンドの反転点を判断し,MACDは中長期トレンドを判断し,両者は,短期反転を実現しながら中長期トレンドの多空信号をロックします.
戦略原則
この戦略は2つの部分から構成されています.
123反転部分:現在の2つのK線が高点/低点を形成し,ランダムな指標が50以下/以上になると買/売シグナルを生成する.
MACD部分: 快線が慢線を横切るときに買い信号を生じ,快線の下が慢線を横切るときに売り信号を生成する.
最後に両者を組み合わせて,つまり123の反転と同時にMACDも同方向信号を生じるとき,最終信号を発する.
優位分析
この戦略は,短期反転と中長期のトレンドを組み合わせ,短期波動の中で中長期のトレンドをロックして,それにより高い勝率を得ることができる.特に,震動の状況では,123反転で部分的なノイズを消去して,それにより安定性を高める.
また,パラメータを調整することで,反転信号とトレンド信号の比率をバランスさせ,異なる市場環境に対応することができる.
リスク分析
この戦略には一定の時間遅れがあり,特に長期周期MACDを使用すると,短期的な動きを見逃す可能性があります.また,反転信号自体は一定程度のランダム性があり,簡単に捕らえられます.
MACDサイクルを適切に短縮するか,リスク管理のためにストップを増加させることができる.
最適化の方向
この戦略は以下の点で最適化できます.
123の反転パラメータを調整し,反転効果を最適化
MACDパラメータを調整し,トレンド判断を最適化する
他の補助指標のフィルターを追加して,効果を上げます.
リスク管理のための止損策の強化
要約する
この戦略は,複数のパラメータと複数の時間枠の技術指標を統合し,時間枠の動きを追跡することによって,反転取引とトレンド取引の優位性をバランスします.パラメータによってバランスの効果を調整し,より多くの指標または停止を導入して最適化することができます.これは非常に潜在的な戦略アイデアです.
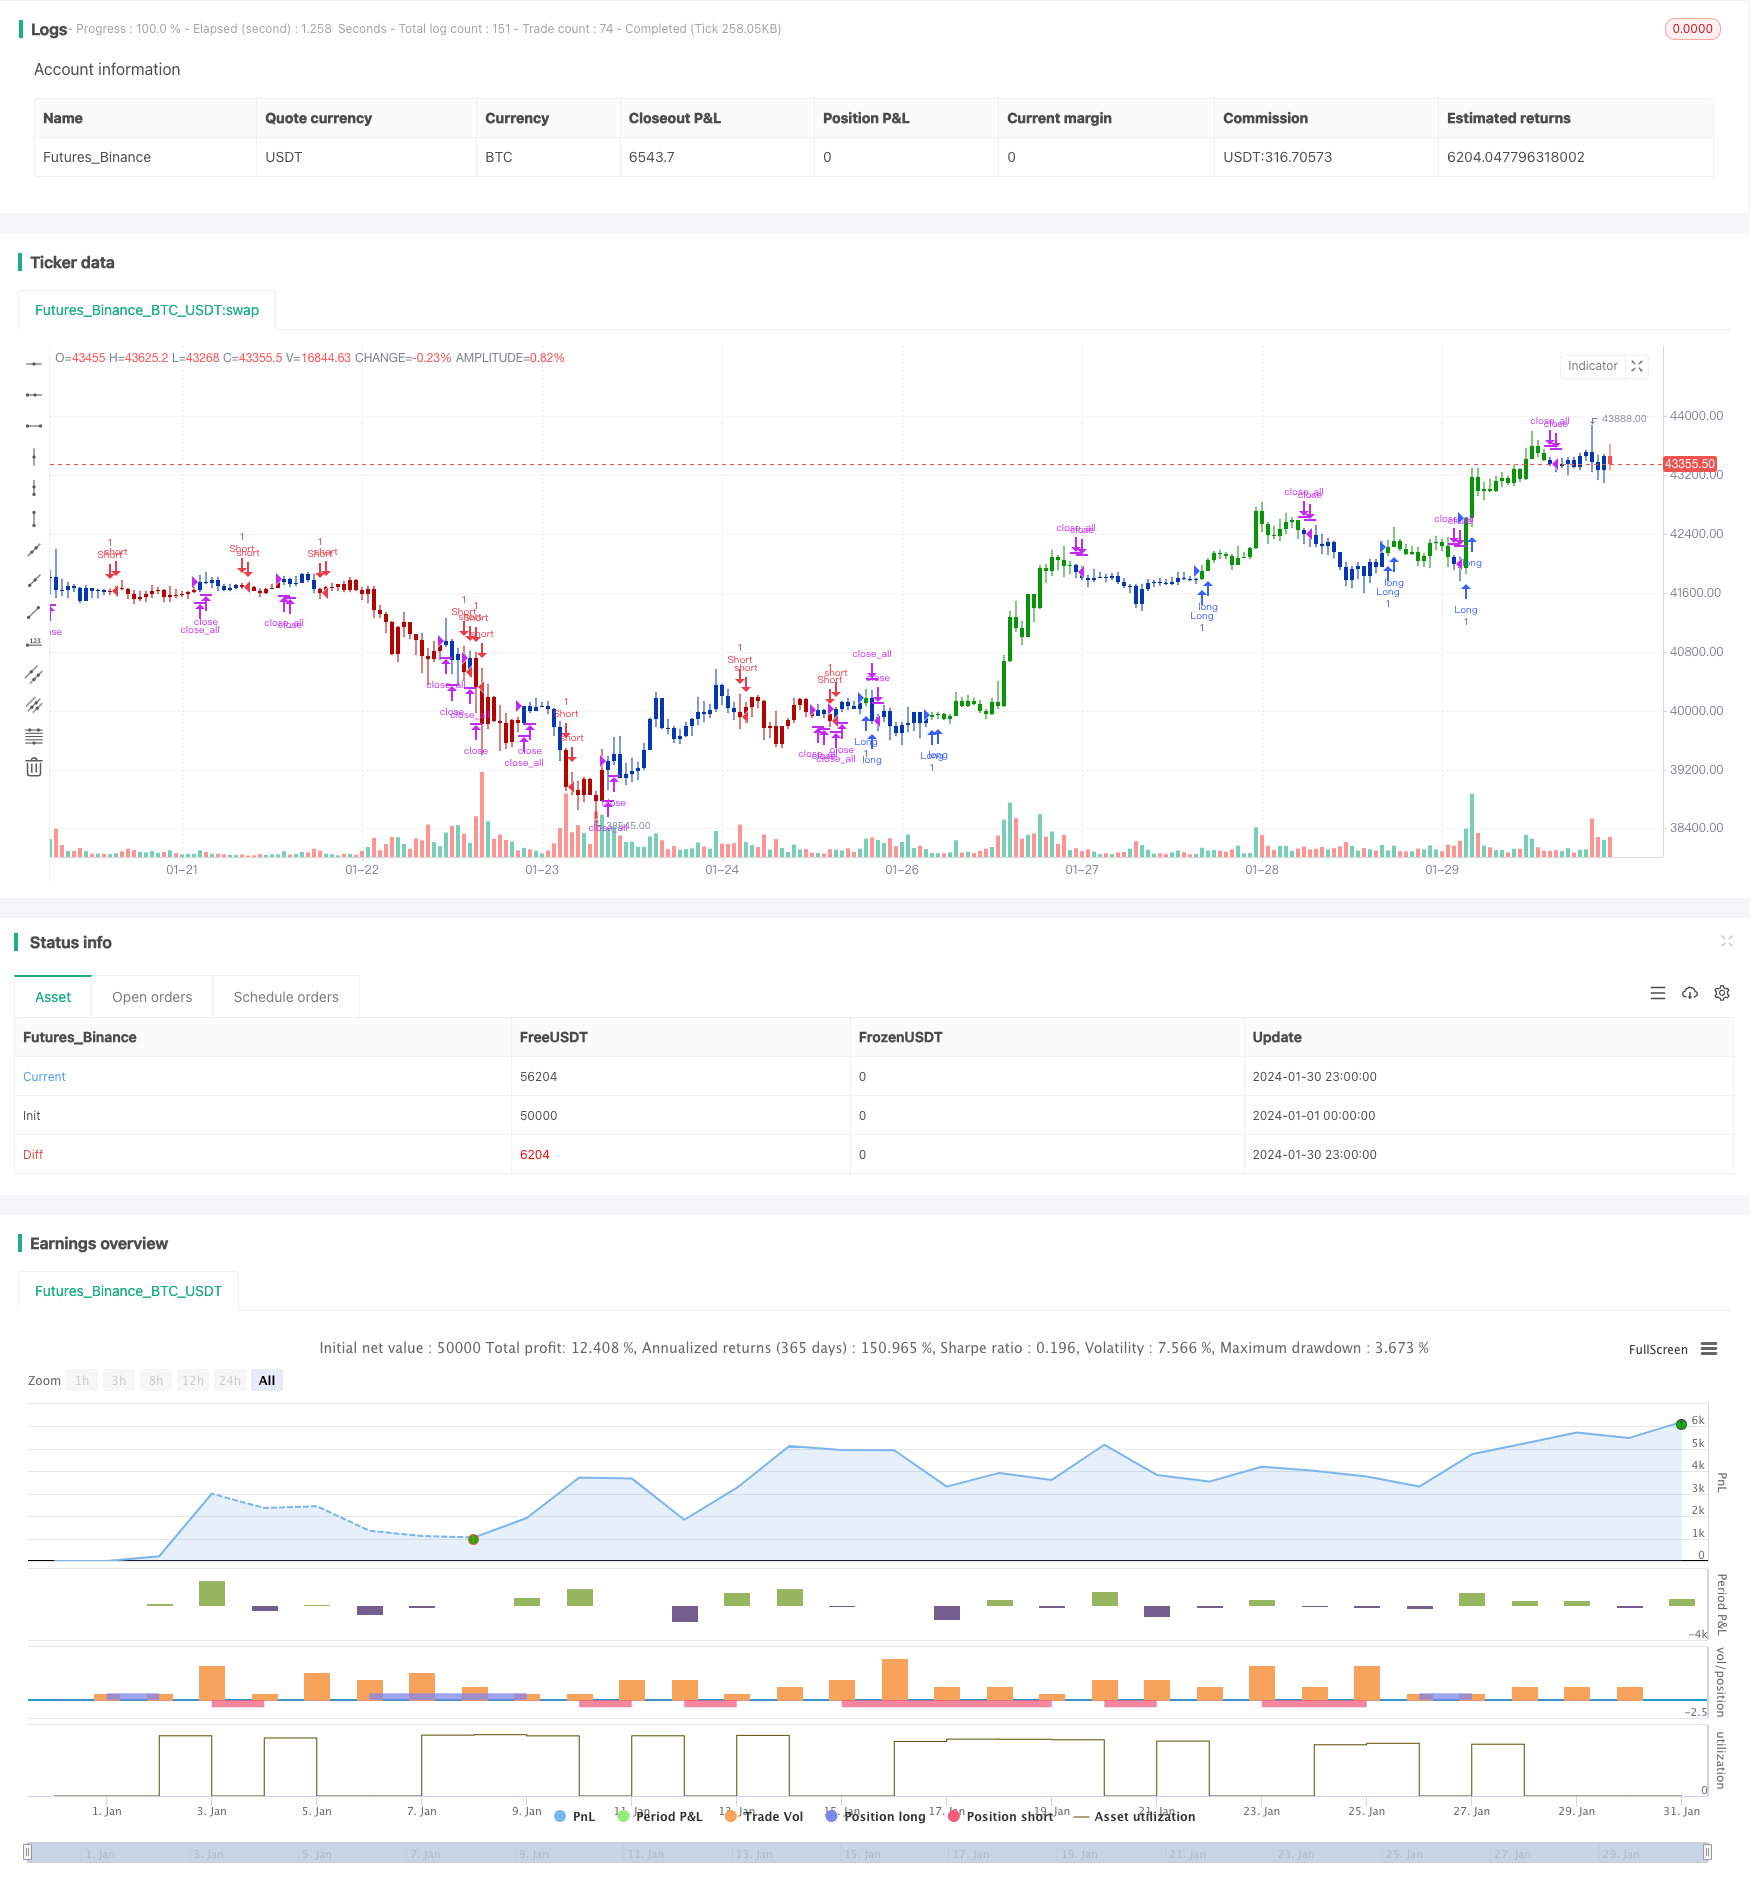
/*backtest
start: 2024-01-01 00:00:00
end: 2024-01-31 00:00:00
period: 1h
basePeriod: 15m
exchanges: [{"eid":"Futures_Binance","currency":"BTC_USDT"}]
*/

//@version=4
////////////////////////////////////////////////////////////
//  Copyright by HPotter v1.0 28/01/2021
// This is combo strategies for get a cumulative signal.
//
// First strategy
// This System was created from the Book "How I Tripled My Money In The
// Futures Market" by Ulf Jensen, Page 183. This is reverse type of strategies.
// The strategy buys at market, if close price is higher than the previous close
// during 2 days and the meaning of 9-days Stochastic Slow Oscillator is lower than 50.
// The strategy sells at market, if close price is lower than the previous close price
// during 2 days and the meaning of 9-days Stochastic Fast Oscillator is higher than 50.
//
// Second strategy
// MACD – Moving Average Convergence Divergence. The MACD is calculated
// by subtracting a 26-day moving average of a security's price from a
// 12-day moving average of its price. The result is an indicator that
// oscillates above and below zero. When the MACD is above zero, it means
// the 12-day moving average is higher than the 26-day moving average.
// This is bullish as it shows that current expectations (i.e., the 12-day
// moving average) are more bullish than previous expectations (i.e., the
// 26-day average). This implies a bullish, or upward, shift in the supply/demand
// lines. When the MACD falls below zero, it means that the 12-day moving average
// is less than the 26-day moving average, implying a bearish shift in the
// supply/demand lines.
// A 9-day moving average of the MACD (not of the security's price) is usually
// plotted on top of the MACD indicator. This line is referred to as the "signal"
// line. The signal line anticipates the convergence of the two moving averages
// (i.e., the movement of the MACD toward the zero line).
// Let's consider the rational behind this technique. The MACD is the difference
// between two moving averages of price. When the shorter-term moving average rises
// above the longer-term moving average (i.e., the MACD rises above zero), it means
// that investor expectations are becoming more bullish (i.e., there has been an
// upward shift in the supply/demand lines). By plotting a 9-day moving average of
// the MACD, we can see the changing of expectations (i.e., the shifting of the
// supply/demand lines) as they occur.
//
// WARNING:
// - For purpose educate only
// - This script to change bars colors.
////////////////////////////////////////////////////////////
Reversal123(Length, KSmoothing, DLength, Level) =>
    vFast = sma(stoch(close, high, low, Length), KSmoothing)
    vSlow = sma(vFast, DLength)
    pos = 0.0
    pos := iff(close[2] < close[1] and close > close[1] and vFast < vSlow and vFast > Level, 1,
	         iff(close[2] > close[1] and close < close[1] and vFast > vSlow and vFast < Level, -1, nz(pos[1], 0)))
	pos

MACD(fastLength,slowLength,signalLength) =>
    pos = 0.0
    fastMA = ema(close, fastLength)
    slowMA = ema(close, slowLength)
    macd = fastMA - slowMA
    signal = sma(macd, signalLength)
    pos:= iff(signal < macd , 1,
	       iff(signal > macd, -1, nz(pos[1], 0)))
    pos

strategy(title="Combo Backtest 123 Reversal & MACD Crossover", shorttitle="Combo", overlay = true)
line1 = input(true, "---- 123 Reversal ----")
Length = input(14, minval=1)
KSmoothing = input(1, minval=1)
DLength = input(3, minval=1)
Level = input(50, minval=1)
//-------------------------
fastLength = input(8, minval=1)
slowLength = input(16,minval=1)
signalLength=input(11,minval=1)
xSeria = input(title="Source", type=input.source, defval=close)
reverse = input(false, title="Trade reverse")
posReversal123 = Reversal123(Length, KSmoothing, DLength, Level)
posMACD = MACD(fastLength,slowLength, signalLength)
pos = iff(posReversal123 == 1 and posMACD == 1 , 1,
	   iff(posReversal123 == -1 and posMACD == -1, -1, 0))
possig = iff(reverse and pos == 1, -1,
          iff(reverse and pos == -1 , 1, pos))
if (possig == 1)
    strategy.entry("Long", strategy.long)
if (possig == -1)
    strategy.entry("Short", strategy.short)
if (possig == 0)
    strategy.close_all()
barcolor(possig == -1 ? #b50404: possig == 1 ? #079605 : #0536b3 )