モメンタムブレイクアウト短期取引戦略
作成日:
2024-02-01 10:32:21
最終変更日:
2024-02-01 10:32:21
コピー:
0
クリック数:
796
1
フォロー
1750
フォロワー
概要
この戦略は,SPY取引データを追跡し,移動平均,MACD,RSIなどの複数の技術指標の信号と組み合わせて,短期的な動きを正確に判断し,ショートライン取引で利益を得るために購入や販売の決定を下します.
戦略原則
この戦略の核心的な論理は,短期的なトレンドと入場タイミングを判断するための以下の技術指標に基づいています.
- 5日と13日の指数移動平均 ((EMA) の金叉と死叉は多空傾向の転換を判断するために使用される.
- MACD指数は,上昇傾向があるかどうかを判断する.
- ADXの指標は,トレンドがあるかどうかを判断する.
- RSIはトレンドの強さを判断する指標である.
上記の指標パラメータを最適化して,鍵となる多空の転換点を判断する。5/6の条件を満たしたときに白信号提示LまたはSを表示し,完全な6の条件を満たしたときに,この図の閉盘時に黄色の△形信号を表示する。
買取シグナルが形成される条件は
5日EMAは13日EMAより大きく,MACD線は0.5より低く,ADXは20より高く,MACD斜率は0より高く,シグナル線は-0.1より高く,RSIは40より高く
売るための条件は:
5日EMAは13日EMA未満で,MACD線は-0.5以上で,ADXは20以上で,シグナル線は0未満で,MACD斜率は0未満で,RSIは60未満
優位分析
この戦略の利点は以下の通りです.
- 複数の指標信号を組み合わせることで判断の正確性が高くなります.
- パラメータの最適化により,判断の感度と精度がバランスを取ります.
- 信号判断は簡潔で,操作の限界は低い.
- ショートライン取引に適しており,ほとんどの投資家のリスク好みに合致する.
- リアルタイムの操作を考慮し,尾行時間の波動を避ける.
リスク分析
この戦略には以下のリスクもあります.
- パラメータ設定が不適切である場合,誤判の危険性がある.継続的なテストと最適化が必要である.
- 単一品種で,業界や資産配置のリスクを分散させることはできません.
- 頻繁に取引する取引手数料とスライドポイントのリスク.
- 尾行時間には入庫ができず,機会を逃してしまうかもしれない.
最適化の方向
この戦略は,以下の側面からさらに最適化できます.
- テストのパラメータ設定を修正して判断の精度を高めます.
- 単一損失を抑えるため,ストップ・ロスの指数を増やします.
- ポジション開設時間を最適化し,尾張高波動期をフィルターします.
- 他の品種を戦略対象に追加する
- 機械学習アルゴリズムと組み合わせたパラメータの自律性を向上させる.
要約する
この戦略は,SPYデータを追跡し,移動平均,MACD,RSIなどの複数の技術指標と組み合わせて,短期トレンドを判断し,操作頻度が高く,撤回が低い.短線取引に適しています.
ストラテジーソースコード
/*backtest
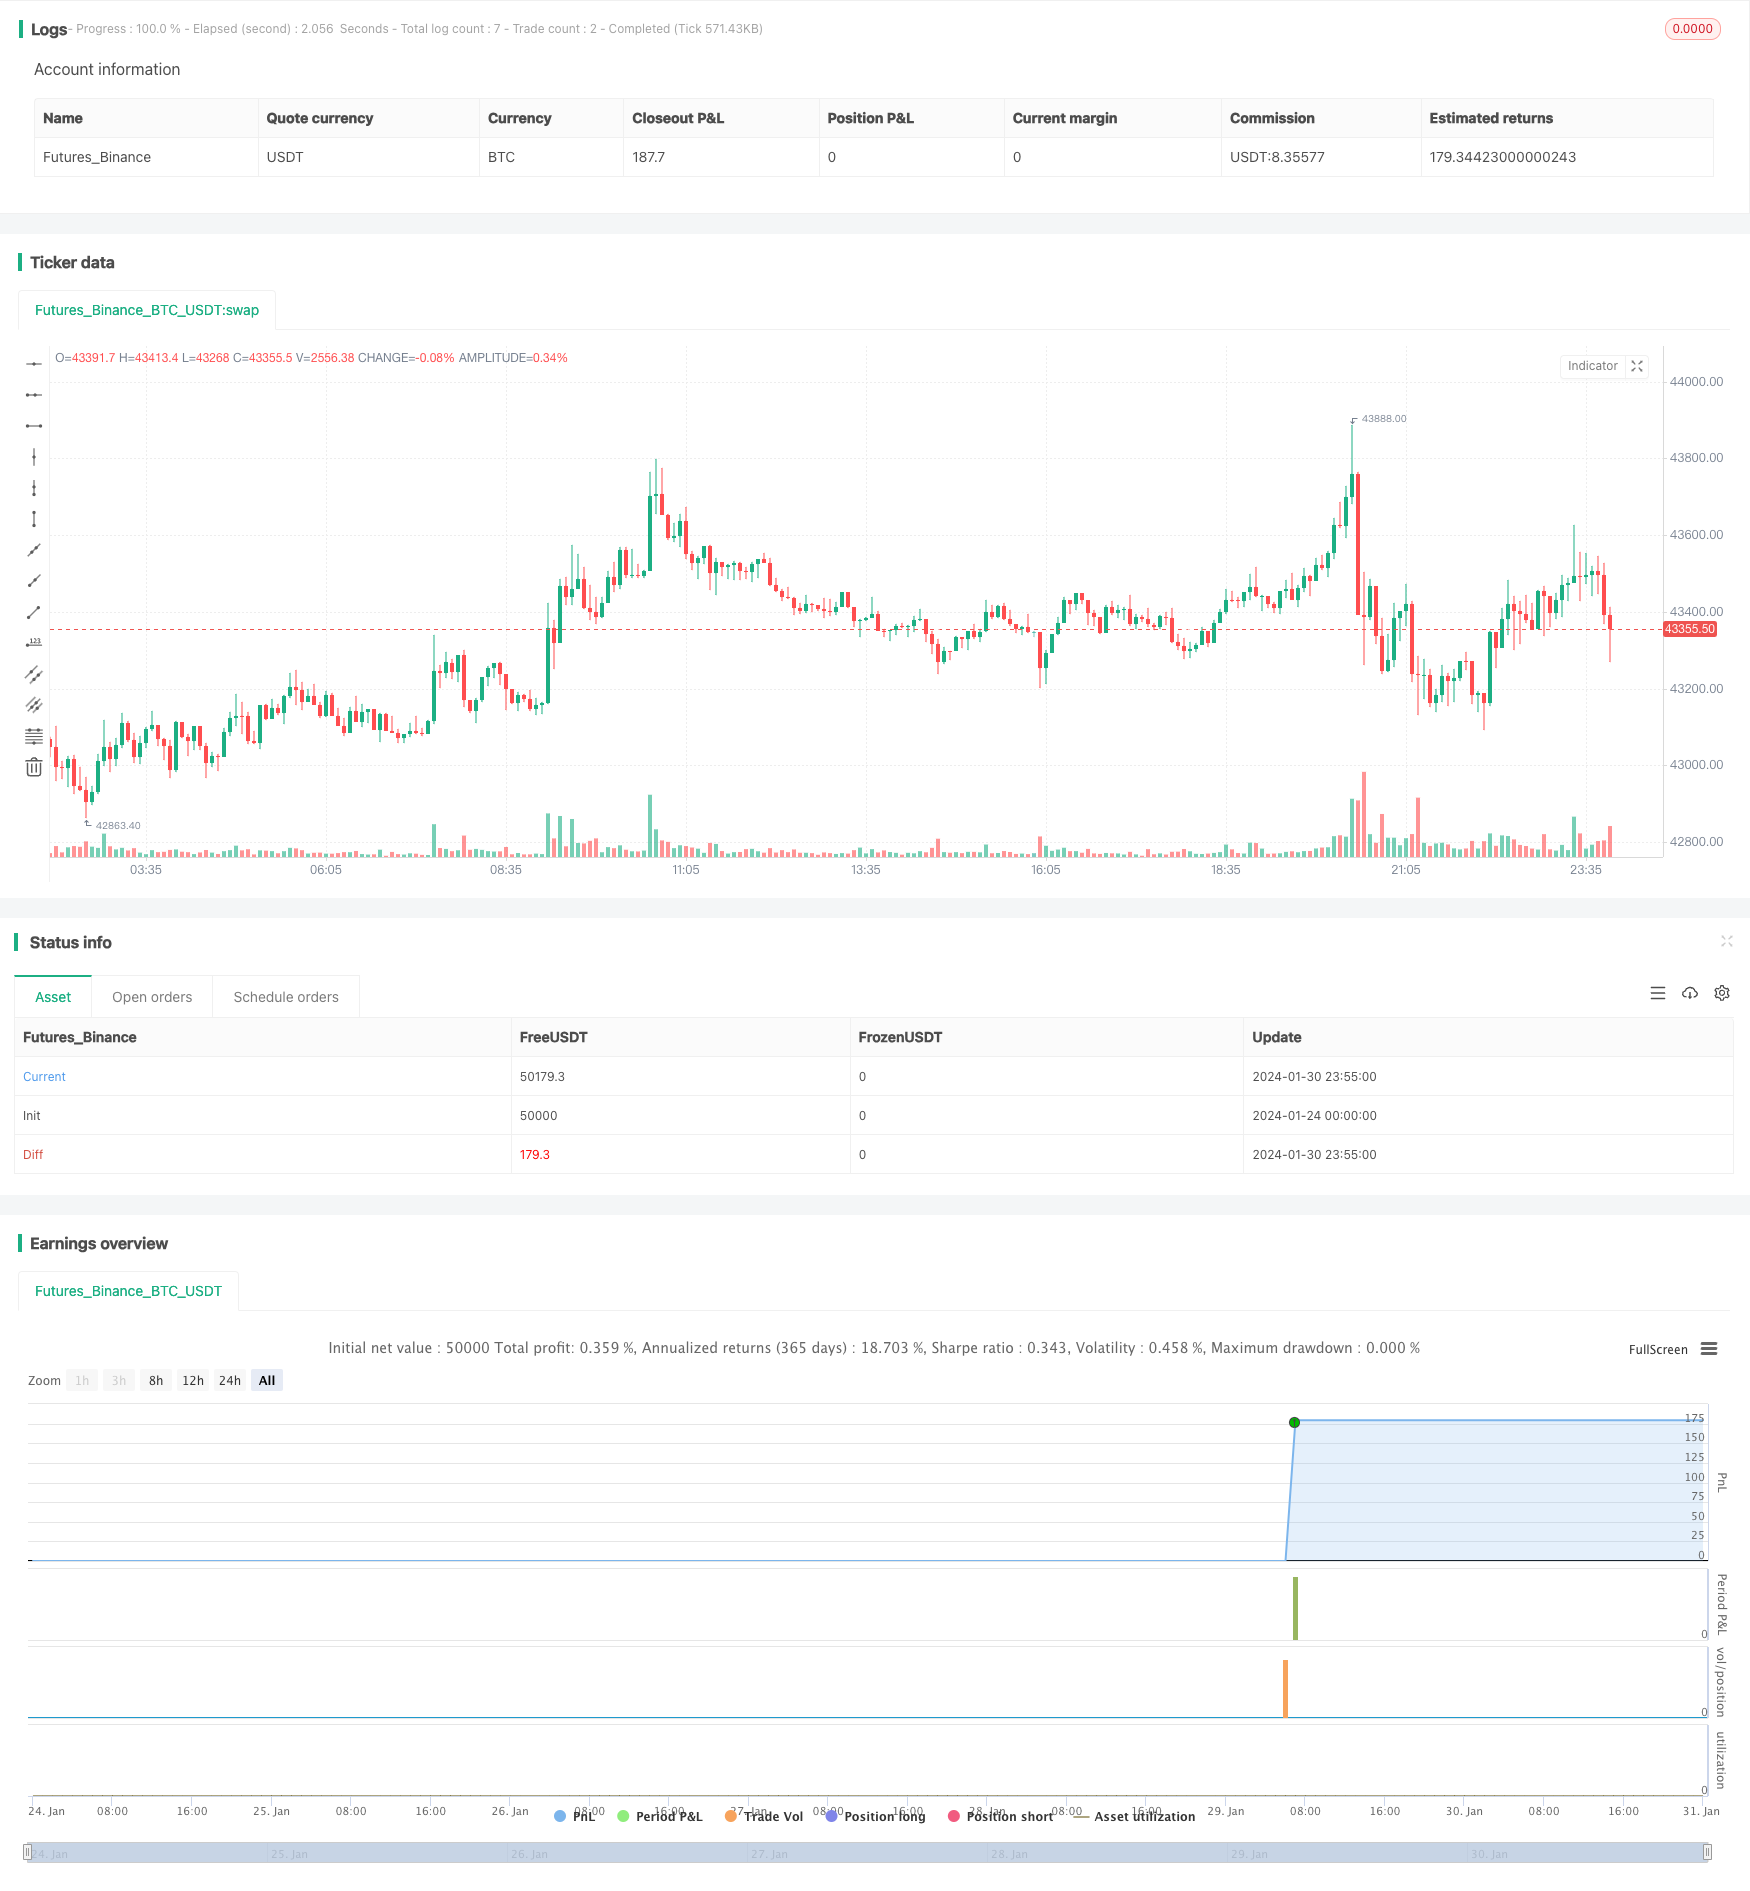
start: 2024-01-24 00:00:00
end: 2024-01-31 00:00:00
period: 5m
basePeriod: 1m
exchanges: [{"eid":"Futures_Binance","currency":"BTC_USDT"}]
*/
//@version=5
strategy(title="SPY 1 Minute Day Trader", overlay=true)
//This script has been created to take into account how the following variables impact trend for SPY 1 Minute
//The SPY stop losses/take profit have been set at 30 cents which equates to 15 cents on SPY 1 DTE ATM contracts
//5 ema vs 13 ema : A cross establishes start of trend
//MACD (Line, Signal & Slope) : If you have momentum
//ADX : if you are trending
//RSI : If the trend has strength
//The above has been optimized to determine pivot points in the trend using key values for these 6 indicators
//bounce up = ema5 > ema13 and macdLine < .5 and adx > 20 and macdSlope > 0 and signalLine > -.1 and rsiSignal > 40
//bounce down = ema5 < ema13 and macdLine > -.5 and adx > 20 and signalLine < 0 and macdSlope < 0 and rsiSignal < 60
//White L's indicate that 5 of 6 conditions are met due to impending uptrend w/ missing one in green below it
//Yellow L's indicate that 6 of 6 conditions still are met
//White S's indicate that 5 of 6 conditions are met due to impending downtrend w/ missing condition in red above it
//Yellow S's indicate that 6 of 6 conditions still are met
//After a downtrend or uptrend is established, once it closes it can't repeat for 10 minutes
//Won't open any trades on last two minutes of any hours to avoid volatility
//Will close any open trades going into last minute of hour
// Initialize variables
var float long_entry_price = na
var float short_entry_price = na
var float stop_loss = na
var float take_profit = na
var float short_stop_loss = na
var float short_take_profit = na
var float option_SL = 0.3 //approx 15 cents on SPY 1 DTE
var float option_TP = 0.3 //approx 15 cents on SPY 1 DTE
var long_entry_time = 0
var short_entry_time = 0
var allow_long_entry = true
var allow_short_entry = true
var allow_trades = true
var hourlyclose = 0
var notify = 0
var shortnotify = 0
// Calculate the EMAs & SMAs
ema5 = ta.ema(close, 5)
ema13 = ta.ema(close, 13)
sma20 = ta.sma(close, 20)
// Input parameters
fastLength = input.int(12, minval=1, title="Fast Length")
slowLength = input.int(26, minval=1, title="Slow Length")
signalLength = input.int(9, minval=1, title="Signal Smoothing")
// Inputs
length = input.int(14, "Length")
smoothK = input.int(3, "SmoothK")
src = input(close, "Source")
overbought = input.float(80, "Overbought")
oversold = input.float(20, "Oversold")
//Stochastic Calculation
highestHigh = ta.highest(src, length)
lowestLow = ta.lowest(src, length)
k = 100 * ((src - lowestLow) / (highestHigh - lowestLow))
d = ta.sma(k, smoothK)
// Calculate MACD
[macdLines, signalLines, _] = ta.macd(close, fastLength, slowLength, signalLength)
// Calculate slope of MACD line
macdSlope = (macdLines - macdLines[1]) / (bar_index - bar_index[1])
// Calculate the RSI
rsiValue = ta.rsi(close, 5)
// Calculate the signal line as the SMA of the RSI for 5 minute over 9 periods
rsiSignal = ta.sma(rsiValue, 9)
// Calculate MACD
[macdLine, signalLine, _] = ta.macd(close, 12, 26, 9)
// Length of the ATR
atr_length = input.int(14, title="ATR Length", minval=1)
// Calculate the True Range
tr = ta.tr(true)
// Calculate the ATR
atr = ta.atr(atr_length)
// Length of the ADX
len = input.int(14, minval=1)
// Set minimum number of bars between trades
min_bars_between_trades = 10
// Calculate the Directional Movement
up = ta.change(high)
down = -ta.change(low)
plusDM = na(up) ? na : (up > down and up > 0 ? up : 0)
minusDM = na(down) ? na : (down > up and down > 0 ? down : 0)
// Calculate the Smoothed Directional Movement
plusDI = 100 * ta.ema(plusDM, len) / ta.ema(tr, len)
minusDI = 100 * ta.ema(minusDM, len) / ta.ema(tr, len)
// Calculate the Directional Index (DX)
DX = 100 * math.abs(plusDI - minusDI) / (plusDI + minusDI)
// Calculate the ADX
adx = ta.ema(DX, len)
// Get high, low, and close prices
highPrice = high
lowPrice = low
closePrice = close
// Determine buy and sell signals - Tried to optimize as much as possible - changing these do impact results
buy_signal = ema5 > ema13 and macdLine < .5 and adx > 20 and macdSlope > 0 and signalLine > -.1 and rsiSignal > 40
short_buy_signal = ema5 < ema13 and macdLine > -.5 and adx > 20 and signalLine < 0 and macdSlope < 0 and rsiSignal < 60
// Define long entry conditions
C1 = ema5 > ema13 ? 1 : 0 //E below bar when only one missing
C2 = d < 70 ? 1 : 0 //no longer part of signal - but was Smoothed Stoicastic
C3 = macdLine < .5 ? 1 : 0 //M below bar when only one missing
C4 = adx > 20 ? 1 : 0 //A below bar when only one missing
C5 = macdSlope > 0 ? 1 : 0 //% below bar when only one missing
C6 = signalLine > -.01 ? 1 : 0 //S (MACD Signal) below bar when only one missing
C7 = rsiSignal > 50 ? 1 : 0 //R below bar when only one missing
// Define short entry conditions
C8 = ema5 < ema13 ? 1 : 0 //E above bar when only one missing
C9 = d > 40 ? 1 : 0 //no longer part of signal - but was Smoothed Stoicastic
C10 = macdLine > -0.5 ? 1 : 0 //M above bar when only one missing
C11 = adx > 20 ? 1 : 0 //A above bar when only one missing
C12 = macdSlope < 0 ? 1 : 0 //% above bar when only one missing
C13 = signalLine < 0 ? 1 : 0 //S (MACD Signal) above bar when only one missing
C14 = rsiSignal < 50 ? 1 : 0 //R above bar when only one missing
// Long or Short Incoming denoted by white color and gold means all conditions met
plotchar((C1 + C3 + C4 + C5 + C6 + C7) == 5 ? 1 : na, title="Pivot Up White", char="L", location=location.belowbar, color=color.white, size = size.tiny)
plotchar((C8 + C10 + C11 + C12 + C13 + C14) == 5 ? 1 : na, title="Pivot Down White", char="S", location=location.abovebar, color=color.white, size = size.tiny)
plotchar((C1 + C3 + C4 + C5 + C6 + C7) > 5 ? 1 : na, title="Pivot Up Gold", char="L", location=location.belowbar, color=color.yellow, size = size.tiny)
plotchar((C8 + C10 + C11 + C12 + C13 + C14) > 5 ? 1 : na, title="Pivot Down Gold", char="S", location=location.abovebar, color=color.yellow, size = size.tiny)
plotchar((C1 + C3 + C4 + C5 + C6 + C7) >= 5 and (C1) != 1 ? 1 : na, title="Missing", char = "", text="E", location=location.belowbar, color=color.green, size = size.small)
plotchar((C1 + C3 + C4 + C5 + C6 + C7) >= 5 and (C3) != 1 ? 1 : na, title="Missing", char = "", text="M", location=location.belowbar, color=color.green, size = size.small)
plotchar((C1 + C3 + C4 + C5 + C6 + C7) >= 5 and (C4) != 1 ? 1 : na, title="Missing", char = "", text="A", location=location.belowbar, color=color.green, size = size.small)
plotchar((C1 + C3 + C4 + C5 + C6 + C7) >= 5 and (C5) != 1 ? 1 : na, title="Missing", char = "", text="%", location=location.belowbar, color=color.green, size = size.small)
plotchar((C1 + C3 + C4 + C5 + C6 + C7) >= 5 and (C6) != 1 ? 1 : na, title="Missing", char = "", text="S", location=location.belowbar, color=color.green, size = size.small)
plotchar((C1 + C3 + C4 + C5 + C6 + C7) >= 5 and (C7) != 1 ? 1 : na, title="Missing", char = "", text="R", location=location.belowbar, color=color.green, size = size.small)
plotchar((C8 + C10 + C11 + C12 + C13 + C14) >= 5 and (C8) != 1 ? 1 : na, title="Missing", char = "", text="E", location=location.abovebar, color=color.red, size = size.small)
plotchar((C8 + C10 + C11 + C12 + C13 + C14) >= 5 and (C10) != 1 ? 1 : na, title="Missing", char = "", text="M", location=location.abovebar, color=color.red, size = size.small)
plotchar((C8 + C10 + C11 + C12 + C13 + C14) >= 5 and (C11) != 1 ? 1 : na, title="Missing", char = "", text="A", location=location.abovebar, color=color.red, size = size.small)
plotchar((C8 + C10 + C11 + C12 + C13 + C14) >= 5 and (C12) != 1 ? 1 : na, title="Missing", char = "", text="%", location=location.abovebar, color=color.red, size = size.small)
plotchar((C8 + C10 + C11 + C12 + C13 + C14) >= 5 and (C13) != 1 ? 1 : na, title="Missing", char = "", text="S", location=location.abovebar, color=color.red, size = size.small)
plotchar((C8 + C10 + C11 + C12 + C13 + C14) >= 5 and (C14) != 1 ? 1 : na, title="Missing", char = "", text="R", location=location.abovebar, color=color.red, size = size.small)
// Execute buy and sell orders
if buy_signal and allow_trades and allow_long_entry //Don't buy on last 2 minutes of hour
long_entry_price := open
strategy.entry("Pivot Up", strategy.long)
stop_loss := long_entry_price - option_SL
take_profit := long_entry_price + option_TP
long_entry_time := time
allow_long_entry := false
allow_trades := false
notify := 1
plotshape(notify == 1 ? 1 : na, "Pivot Up", style=shape.triangleup, offset = 1, location=location.belowbar, size=size.normal, textcolor = color.orange, color=color.orange)
if notify == 1
notify := notify - 1
if short_buy_signal and allow_trades and allow_short_entry //Don't buy on last 2 minutes of hour
short_entry_price := open
strategy.entry("Pivot Down", strategy.short)
short_stop_loss := short_entry_price + option_SL
short_take_profit := short_entry_price - option_TP
short_entry_time := time
allow_short_entry := false
allow_trades := false
shortnotify := 1
plotshape(shortnotify == 1 ? 1 : na, "Pivot Down", style=shape.triangledown, offset = 1, location=location.abovebar, size=size.normal, textcolor = color.orange, color=color.orange)
if shortnotify == 1
shortnotify := shortnotify - 1
// Take scalp when in a position and 5 or more parameters are met!
if strategy.position_size != 0 and (C1 + C3 + C4 + C5 + C6 + C7) >5
strategy.exit("Exit Longs", "Pivot Up", stop=stop_loss, limit = take_profit)
else if strategy.position_size != 0 and (C8 + C10 + C11 + C12 + C13 + C14) >5
strategy.exit("Exit Shorts", "Pivot Down", stop=short_stop_loss, limit = short_take_profit)
// Reset allow_trades after cool-down period of min_bars_between_trades bars set above
if time > long_entry_time + (time - time[1]) * min_bars_between_trades
allow_long_entry := true
allow_trades := true
if time > short_entry_time + (time - time[1]) * min_bars_between_trades
allow_short_entry := true
allow_trades := true
// Close all positions at the end of the trading day and when volatile hours approach!
if strategy.position_size != 0
strategy.close("Pivot Up")
strategy.close("Pivot Down")
hourlyclose := 1
plotshape(hourlyclose == 1 ? 1 : na, "Suggested Volatile Hour Close", text="Suggested Volatile Hour Close", offset = 1, style=shape.triangledown, location=location.abovebar, size=size.tiny, textcolor = color.orange, color=color.orange)
if hourlyclose == 1
hourlyclose := hourlyclose - 1