二重移動平均とRSI指標を使用したロングショートクロスオーバー戦略
作成日:
2024-02-01 11:48:51
最終変更日:
2024-02-01 11:48:51
コピー:
0
クリック数:
898
1
フォロー
1750
フォロワー
この戦略は,二重移動平均とRSIの指標を統合して多空のクロストレード戦略を構築する.この戦略は,中長線のトレンドを捉え,短線の指標を使用して不必要な振動を避けることができます.
戦略原則
この戦略は,高速移動平均 ((EMA 59 と EMA 82) と遅い移動平均 ((EMA 96 と EMA 95)) の2つの移動平均を使用します. 価格が下から上に向かって高速移動平均を横切るときは,多めにします. 価格が上から下に向かって高速移動平均を横切るときは,空っぽにします. 同時に,RSIの過買過売領域は,取引信号とストップを確認するために使用されます.
具体的には,高速EMAが向上して慢速EMAを突破すると多頭シグナルが生成される.このとき,RSIが30より低い場合 (超売り地域),多頭入場が行われる.高速EMAがダウンして慢速EMAを破るとき,空頭シグナルが生成される.このときRSIが70より高い場合 (超買い地域),空頭入場が行われる.
二重移動平均を使用する利点は,中長線のトレンドの変化をよりよく識別できるということです. RSI指標は,偽の突破による一部のノイズ取引をフィルターすることができます.
戦略的優位性
- 移動平均の2つを使って中長線を捉える
- RSIは騒音をフィルターする取引
- トレンドフォローと反転取引の組み合わせ
- 取引の論理はシンプルで明快です.
リスク分析
- 動きのある平均で生成された取引シグナルが,大きく揺れ動いている市場で騙される可能性がある.
- RSIは,特定の市場の状況下でも失効します.
- ストップポイントの設定は慎重で,過度に緩やかまたは急ぎすぎないようにする必要があります.
戦略最適化の方向性
- より長い周期の移動平均の組み合わせをテストする
- RSIの上昇と低下の区間の変化など,異なるパラメータの調整を試みる
- 取引量指標などの追加フィルタリング条件を追加
- ATRなどの指標を組み合わせたストップ・ストラトジーを最適化
要約する
この戦略は,二重移動平均のトレンドを統合し,RSI指標と逆転取引をフォローする.二重EMAは中長線トレンドの方向を追跡し,RSIは取引信号の有効性と停止を確認するために使用される.これは,パラメータの調整と最適化によって異なる市場環境に適応する簡単な実用的な多空交差戦略である.
ストラテジーソースコード
/*backtest
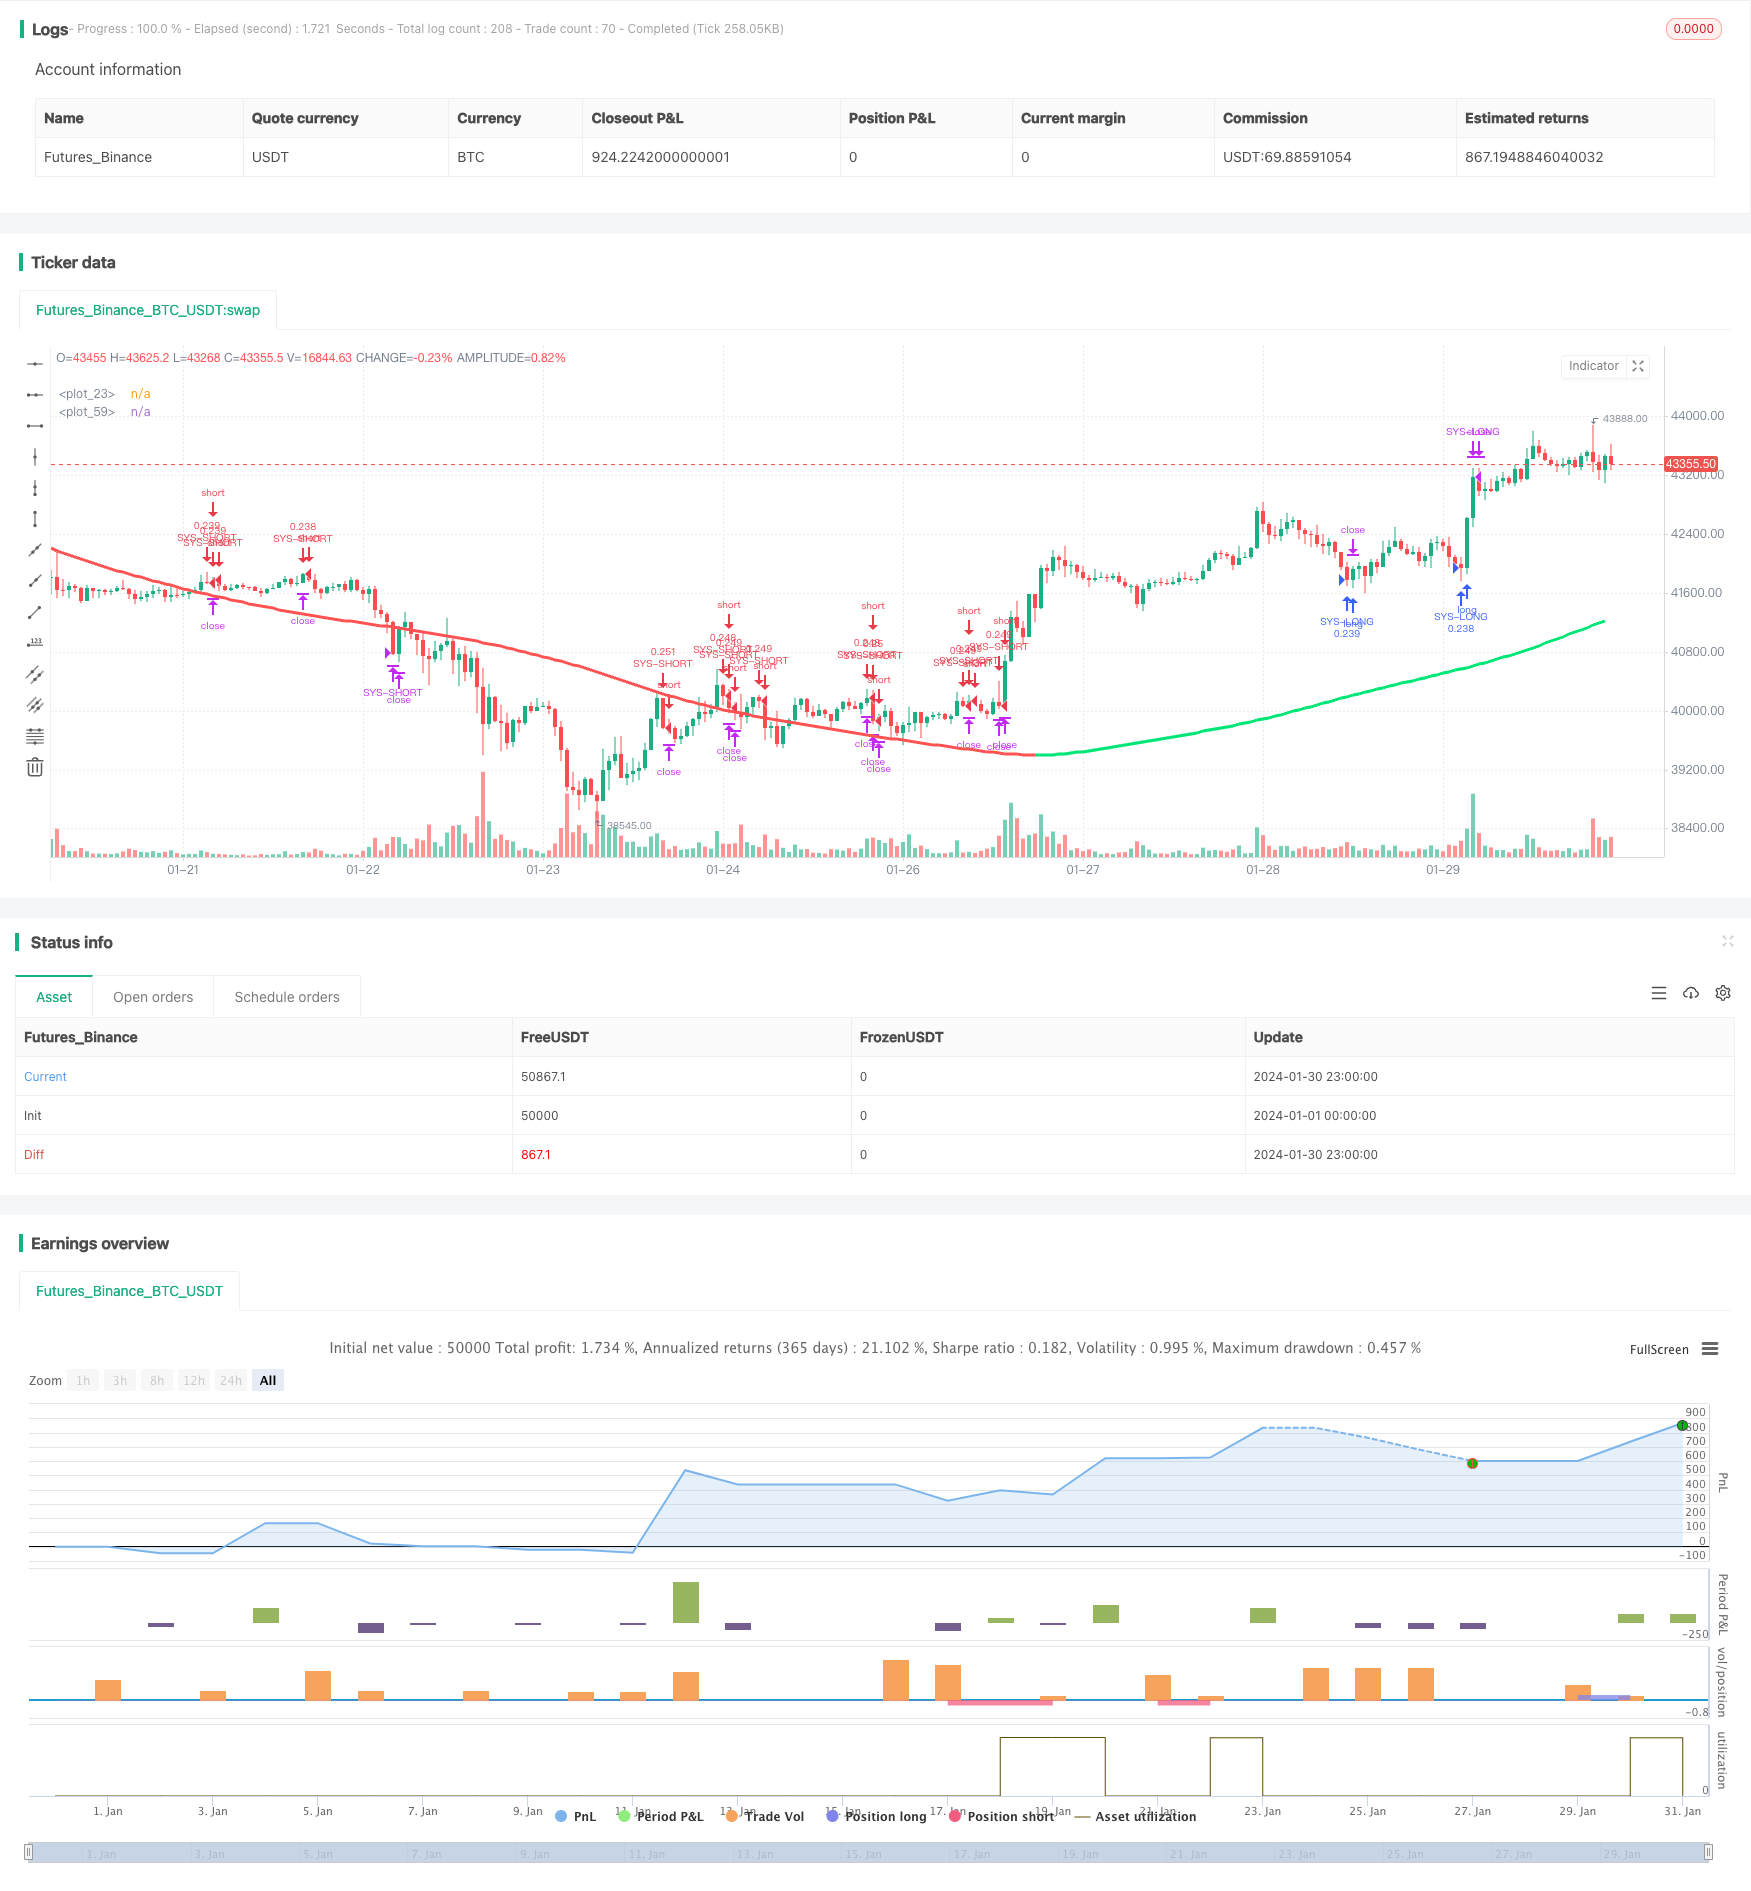
start: 2024-01-01 00:00:00
end: 2024-01-31 00:00:00
period: 1h
basePeriod: 15m
exchanges: [{"eid":"Futures_Binance","currency":"BTC_USDT"}]
*/
//@version=2
strategy("Swing Hull/rsi/EMA Strategy", overlay=true,default_qty_type=strategy.cash,default_qty_value=10000,scale=true,initial_capital=10000,currency=currency.USD)
//A Swing trading strategy that use a combination of indicators, rsi for target, hull for overall direction enad ema for entering the martket.
// hull ma copied from syrowof HullMA who copied from mohamed982 :) thanks both
// Performance
n=input(title="period",defval=500)
n2ma=2*wma(close,round(n/2))
nma=wma(close,n)
diff=n2ma-nma
sqn=round(sqrt(n))
n2ma1=2*wma(close[1],round(n/2))
nma1=wma(close[1],n)
diff1=n2ma1-nma1
sqn1=round(sqrt(n))
n1=wma(diff,sqn)
n2=wma(diff1,sqn)
c=n1>n2?green:red
ma=plot(n1,color=c)
// RSi and Moving averages
length = input( 14 )
overSold = input( 70)
overBought = input( 30)
point = 0.0001
dev= 2
fastLength = input(59)
fastLengthL = input(82)
slowLength = input(96)
slowLengthL = input(95)
price = close
mafast = ema(price, fastLength)
mafastL= ema(price, fastLengthL)
maslow = ema(price, slowLength)
maslowL = ema(price, slowLengthL)
vrsi = rsi(price, length)
cShort = (crossunder(vrsi, overBought))
condDown = n2 >= n1
condUp = condDown != true
closeLong = (crossover(vrsi, overSold))
closeShort = cShort
// Strategy Logic
longCondition = n1> n2
shortCondition = longCondition != true
col =condUp ? lime : condDown ? red : yellow
plot(n1,color=col,linewidth=3)
if (not na(vrsi))
if shortCondition
if (price[0] < maslow[0] and price[1] > mafast[1]) //cross entry
strategy.entry("SYS-SHORT", strategy.short, comment="short")
strategy.close("SYS-SHORT", when=closeShort) //output logic
if (not na(vrsi))
if longCondition // swing condition
if (price[0] < mafast[0] and price[1] > mafast[1]) //cross entry
strategy.entry("SYS-LONG", strategy.long, comment="long")
strategy.close("SYS-LONG", when=closeLong) //output logic
// Stop Loss
sl = input(75)
Stop = sl * 10
Q = 100
strategy.exit("Out Long", "SYS-LONG", qty_percent=Q, loss=Stop)
strategy.exit("Out Short", "SYS-SHORT", qty_percent=Q, loss=Stop)
//plot(strategy.equity, title="equity", color=red, linewidth=2, style=areabr)