モメンタム指標移動平均クロスオーバー戦略
作成日:
2024-02-01 14:50:26
最終変更日:
2024-02-01 14:50:26
コピー:
0
クリック数:
629
1
フォロー
1750
フォロワー
概要
この戦略は,RSI指標とその均線の交差を取引信号として使用し,一般的な動量指標戦略に属します.その核心原理は,RSI指標とRSIの単純な移動平均SMA_RSIの間の差を追跡し,この差を計算します. 単純な移動平均SMA_RSI2,SMA_RSI2を突破する時に多行し,下を突破する時に平仓する.
戦略原則
この戦略は,3つのパラメータを使用して,RSI指標とその2つの異なる周期のシンプル移動平均を計算します. まず,周期がlengthである通常のRSI指標を計算します. 次に,RSIのlength2周期のシンプル移動平均SMA_RSIを計算します. 最後に,RSIとSMA_RSIの差値のデルタを計算し,次に,length3周期のシンプル移動平均SMA_RSI2を計算します.
このようにして,RSI指数平均線交差に基づく取引戦略信号が形成されます.SMA_RSI2は差値デルタの平均線であり,RSI指数の動力と変化の傾向を反映することができ,RSI指数の本質を把握します.
優位分析
この戦略は,RSI指標と均線の優位性を組み合わせ,価格の傾向に順応し,ノイズに惑わされないようにする.差値のデルタ再平滑の考え方を採用し,取引シグナルをより明確にします.全体的に,この戦略は,小回転で,利益が安定しています.
具体的には以下の通りです.
- 差値デルタを使用し,価格変動を平滑化し,偽信号を減らす
- 均線交差形はシンプルで直接的で,簡単に習得できる.
- 市場に応じて調整できるパラメータが多くあります.
- 収益は安定し,撤退は少ない.
リスクと改善
この戦略にはいくつかのリスクがあります.
- 市場規模が大きくても 損失は大きいかもしれません
- 利潤の安定性も不安定です.
改善すべき点は以下の通りです.
- パラメータの最適化,安定性の向上
- 単一損失を抑えるための止損システムへの参加
- 他の指標と組み合わせると,信号の質を向上させる
要約する
この策略は全体的に比較的シンプルで,差値演算によってRSI指数の実用性を高め,均線交差を利用して判断し,引き戻し制御能力が強い.非常に実用的な動量指数策である.
ストラテジーソースコード
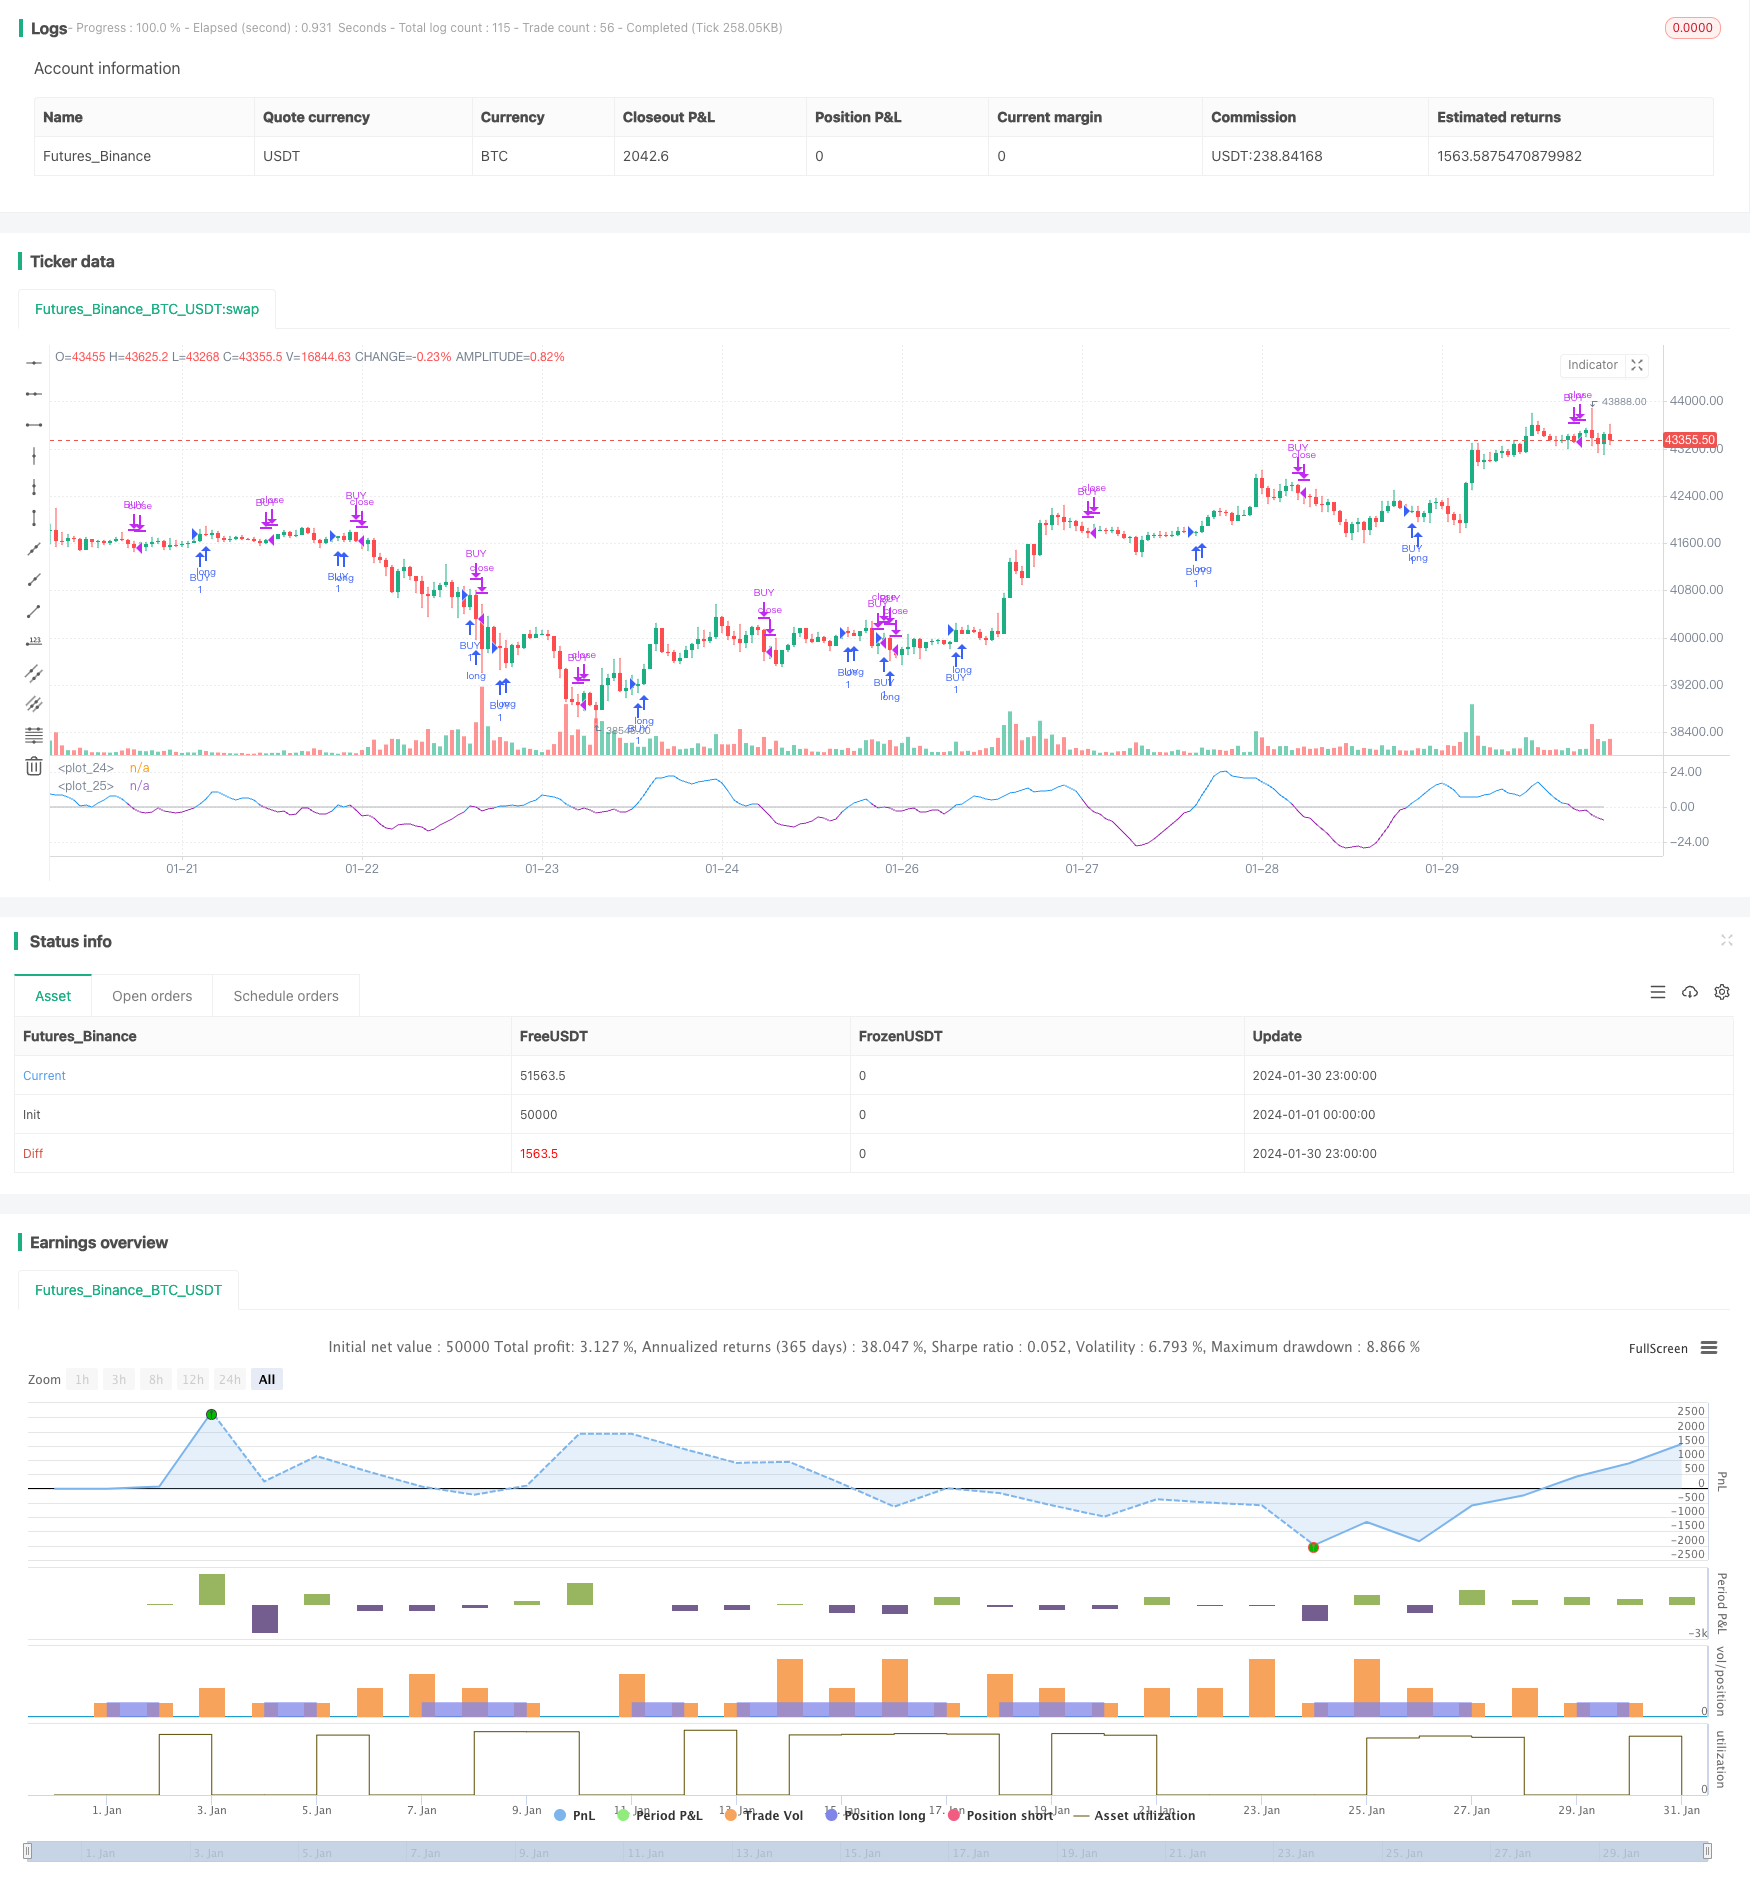
/*backtest
start: 2024-01-01 00:00:00
end: 2024-01-31 00:00:00
period: 1h
basePeriod: 15m
exchanges: [{"eid":"Futures_Binance","currency":"BTC_USDT"}]
*/

//@version=4
strategy ("RSI&SMA", overlay=false )
startP = timestamp(input(2017, "Start Year"), input(12, "Month"), input(17, "Day"), 0, 0)
end   = timestamp((9999), (1), (1), 0, 0)
_testPeriod() => true

length = input(3, minval=1, title = "RSI period")
length2 = input(21, minval=1, title = "RSI SMA-1")
length3 = input(13, minval=1, title = "RSI SMA-2")
threshold  = input(0,step=0.5, title="Threshold")
filter = input(false, title="Use filter?")


up = rma (max (change (close), 0), length)
down = rma (-min (change (close), 0), length)
RSI = down == 0? 100: up == 0? 0: 100-100 / (1 + up / down)

SMA_RSI = sma(RSI, length2)
delta = RSI-SMA_RSI
SMA_RSI2 = sma(delta, length3)
Long = crossover(SMA_RSI2, threshold)
Short = crossunder(SMA_RSI2, threshold)

plot(threshold, color=color.silver)
plot(SMA_RSI2, color= SMA_RSI2 > 0 ? color.blue : color.purple)
//plot(SMA_RSI, color=color.green)
//plot(delta, color=color.red)

long_condition =  Long and (filter ? close > ema(close, 200) : true) and _testPeriod()
strategy.entry('BUY', strategy.long, when=long_condition)

short_condition =  Short
strategy.close('BUY', when=short_condition)