トレンドフォローストップリバーサル戦略
概要
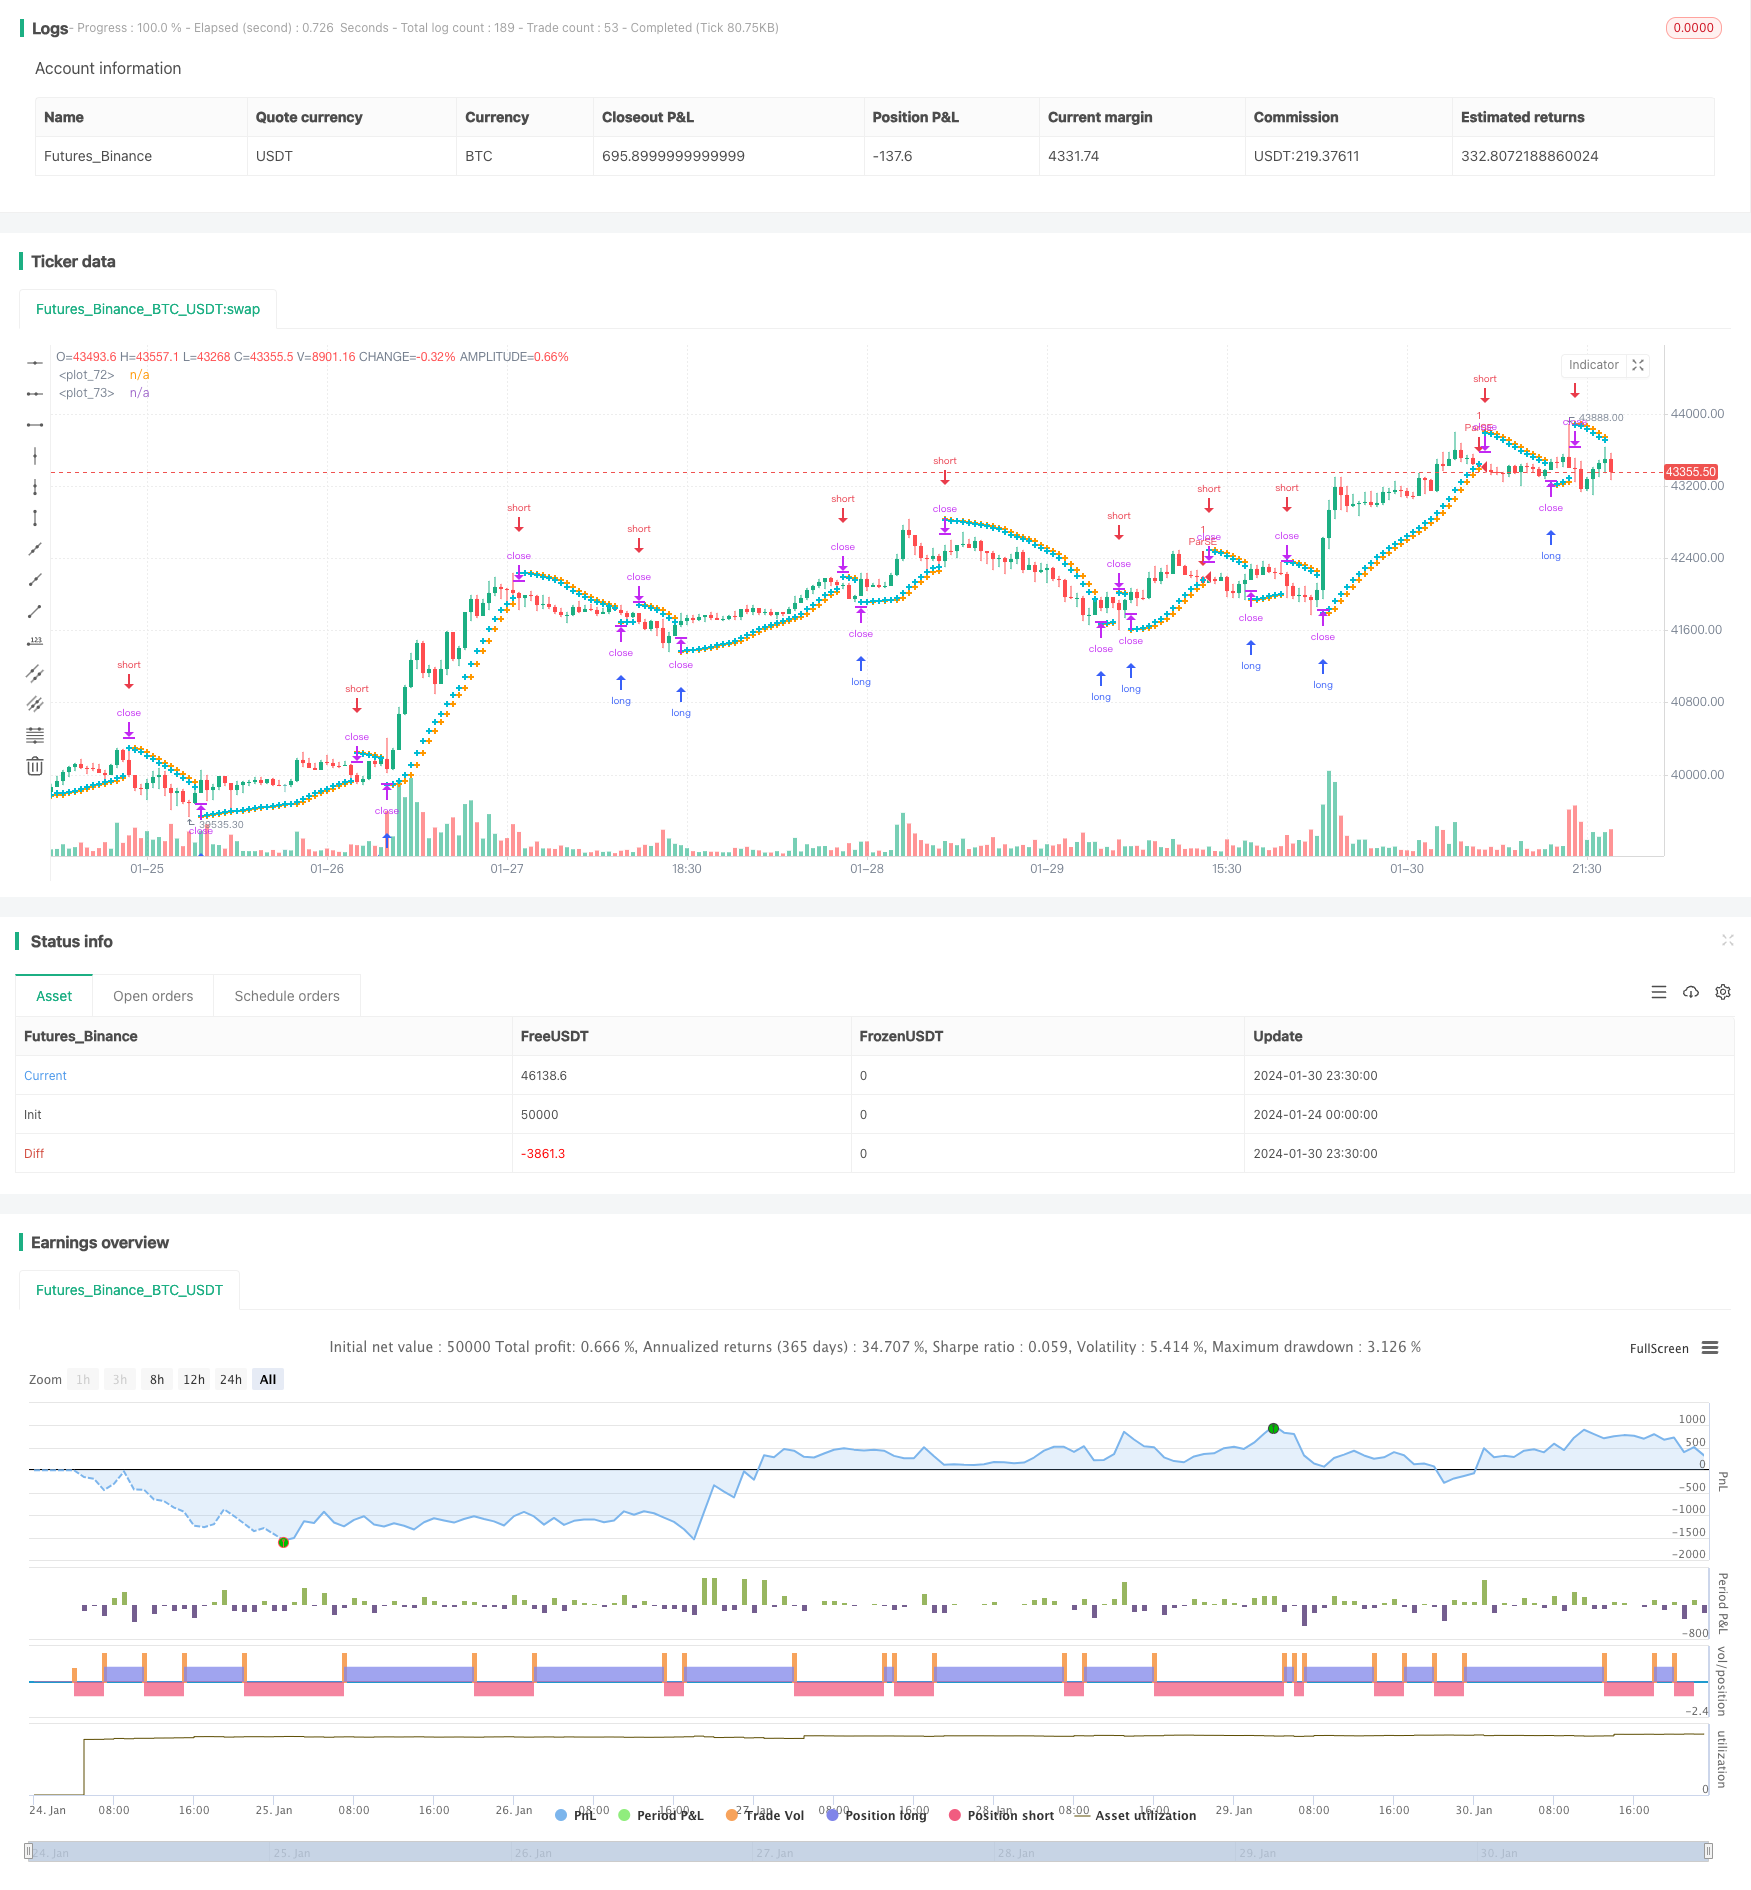
トレンド追跡ストップ・ロズ・リバース戦略は,パラボリックSAR指標を使用してトレンドを識別し,トレンドが逆転すると逆転ポジションに入る戦略である.この戦略は,同時にストップ・ロズとストップ・ストップのメカニズムを組み合わせてリスクを制御する.
戦略原則
この戦略は,パラボリックSAR指数を使用して,現在の市場動向を判断する.パラボリックSARの完全な名前は,パラボリックストップとリバースである.パラボリックストップとリバースは,パラボリックストップとリバースを表す.
SARが下がって価格を下回ると,看板トレンドを表す.SARが上がって価格上回ると,下落トレンドを表す.この戦略は,SARの位置から現在のトレンドの方向を判断することです.
具体的には,SARポイントが上昇傾向で価格より上にあるとき,戦略は空白する.SARポイントが下向き傾向で価格より下にあるとき,戦略は多項を行う.つまり,SARポイントがトレンドの逆転を示しているときに逆転ポジションに入ります.
さらに,この戦略は,止損と停止のメカニズムを設定しています. 過剰な場合,損失を制限するために止損価格を設定する可能性があります. 同時に,価格が一定の目標利益に達した後に平定するストップ価格を設定する可能性があります.空白も同様のメカニズムです.
優位分析
この戦略は,トレンド指標とストップ/ストップ・メカニズムを組み合わせて,以下の主要な利点があります.
- 逆転の機会を把握し,逆転操作を実現する.
- ストップ・ロズとストップ・フードを設定すると,リスクと収益を積極的にコントロールできます.
- パラボリックSARは,かなりよく使われるトレンド逆転指標で,より効果的です.
- 戦略のルールはシンプルでわかりやすく,理解しやすく,実行できます.
リスク分析
この戦略にはいくつかのリスクがあります.
- パラボリックSARは不完全で,時には誤った信号を発する.
- ストップまたはストップ価格を設定することは合理的である必要があります.そうでなければ,早めにストップまたはストップすることがあります.
- 取引手数料は最終利益にも影響する.
- 逆転後,新しい長さの傾向は短期間で続く可能性が高い.
これらのリスクに対して,パラメータの最適化を調整したり,他の指標のフィルタリングと連携して解決することができます.
最適化の方向
この戦略は以下の方向から最適化できます.
- Parabolic SARのパラメータを最適化して,最適なパラメータ組み合わせを探します.
- ストップ・ストップ・ストップ・ストップ・ストップ・ストップ・ストップ・ストップ・ストップ
- 逆転取引信号をフィルタリングするために指標または条件を追加します.
- ポジションコントロールを追加し,市場の状況に応じてポジションを拡大または縮小します.
- 異なる取引品種に対する調整パラメータ。
要約する
このトレンド追跡ストップ・ロズ・リバース戦略は,全体的に比較して古典的な取引戦略である.トレンドリバースを識別する機能を持ち,同時にストップ・ロズとストップ・ストップの手段でリスクを制御する.最適化することで,実用的な戦略となる.
/*backtest
start: 2024-01-24 00:00:00
end: 2024-01-31 00:00:00
period: 30m
basePeriod: 15m
exchanges: [{"eid":"Futures_Binance","currency":"BTC_USDT"}]
*/

//@version=4
strategy("Parabolic SAR Strategy", overlay=true)
start = input(0.02)
increment = input(0.02)
maximum = input(0.2)
var bool uptrend = na
var float EP = na
var float SAR = na
var float AF = start
var float nextBarSAR = na
if bar_index > 0
	firstTrendBar = false
	SAR := nextBarSAR
	if bar_index == 1
		float prevSAR = na
		float prevEP = na
		lowPrev = low[1]
		highPrev = high[1]
		closeCur = close
		closePrev = close[1]
		if closeCur > closePrev
			uptrend := true
			EP := high
			prevSAR := lowPrev
			prevEP := high
		else
			uptrend := false
			EP := low
			prevSAR := highPrev
			prevEP := low
		firstTrendBar := true
		SAR := prevSAR + start * (prevEP - prevSAR)
	if uptrend
		if SAR > low
			firstTrendBar := true
			uptrend := false
			SAR := max(EP, high)
			EP := low
			AF := start
	else
		if SAR < high
			firstTrendBar := true
			uptrend := true
			SAR := min(EP, low)
			EP := high
			AF := start
	if not firstTrendBar
		if uptrend
			if high > EP
				EP := high
				AF := min(AF + increment, maximum)
		else
			if low < EP
				EP := low
				AF := min(AF + increment, maximum)
	if uptrend
		SAR := min(SAR, low[1])
		if bar_index > 1
			SAR := min(SAR, low[2])
	else
		SAR := max(SAR, high[1])
		if bar_index > 1
			SAR := max(SAR, high[2])
	nextBarSAR := SAR + AF * (EP - SAR)
	if barstate.isconfirmed
		if uptrend
			strategy.entry("ParSE", strategy.short, stop=nextBarSAR, comment="ParSE")
			strategy.cancel("ParLE")
		else
			strategy.entry("ParLE", strategy.long, stop=nextBarSAR, comment="ParLE")
			strategy.cancel("ParSE")
plot(SAR, style=plot.style_cross, linewidth=3, color=color.orange)
plot(nextBarSAR, style=plot.style_cross, linewidth=3, color=color.aqua)
//Stop Loss Inputs
use_short_stop_loss = input(false, title="Short Stop Loss", group="Stop Loss and Take Profit", inline="Short_SL")
short_stop_loss = input(title="(%)", type=input.float, minval=0.0, step=0.1,
     defval=5, group="Stop Loss and Take Profit", inline="Short_SL") * 0.01
use_long_stop_loss = input(false, title="Long Stop Loss", group="Stop Loss and Take Profit", inline="Long_SL")
long_stop_loss = input(title="(%)", type=input.float, minval=0.0, step=0.1,
     defval=5, group="Stop Loss and Take Profit", inline="Long_SL") * 0.01

//Take Profit Inputs
use_short_take_profit = input(false, title="Short Take Profit", group="Stop Loss and Take Profit", inline="Short_TP")
short_take_profit = input(title="(%)", type=input.float, minval=0.0, step=0.1,
     defval = 20, group="Stop Loss and Take Profit", inline="Short_TP") * .01
use_long_take_profit = input(false, title="Long Take Profit", group="Stop Loss and Take Profit", inline="Long_TP")
long_take_profit = input(title="(%)", type=input.float, minval=0.0, step=0.1,
     defval = 20, group="Stop Loss and Take Profit", inline="Long_TP") * .01


longStopPrice  = strategy.position_avg_price * (1 - long_stop_loss)
shortStopPrice = strategy.position_avg_price * (1 + short_stop_loss)
longLimitPrice = strategy.position_avg_price * (1 + long_take_profit)
shortLimitPrice = strategy.position_avg_price * (1 - short_take_profit)


if (strategy.position_size > 0.0)
    if (use_long_stop_loss and not use_long_take_profit)
        strategy.exit("Long", stop = longStopPrice)
    if (use_long_take_profit and not use_long_stop_loss)
        strategy.exit("Long", limit = longLimitPrice)
    if (use_long_take_profit and use_long_stop_loss)
        strategy.exit("Long", stop = longStopPrice, limit=longLimitPrice)
if (strategy.position_size < 0.0)
    if (use_short_stop_loss and not use_short_take_profit)
        strategy.exit("Short", stop = shortStopPrice)
    if (use_short_take_profit and not use_short_stop_loss)
        strategy.exit("Short", limit = shortLimitPrice)
    if (use_short_take_profit and use_short_stop_loss)
        strategy.exit("Short", stop = shortStopPrice, limit = shortLimitPrice)

//plot(strategy.equity, title="equity", color=color.red, linewidth=2, style=plot.style_areabr)