二重移動平均定量取引戦略
作成日:
2024-02-01 15:13:13
最終変更日:
2024-02-01 15:13:13
コピー:
1
クリック数:
758
1
フォロー
1751
フォロワー
概要
この戦略は,迅速な移動平均と遅い移動平均を計算し,パラパラ線指数と組み合わせて,買入判断を行うことで,トレンドフォロータイプ戦略に属します. 速い移動平均の上に遅い移動平均を穿越するときに多行; 速い移動平均の下にあるゆっくり移動平均を穿越するときに空行. 同時に,パラパラ線指数と組み合わせて,フィルタリングを偽突破する.
戦略原則
- 速動平均と遅動平均を計算する. 移動平均のパラメータはカスタム可.
- 2つの移動平均を比較して,市場のトレンド方向を判断する.高速移動平均線上をゆっくり移動平均線を越えると,多頭市場と判断する.高速移動平均線下をゆっくり移動平均線を越えると,空頭市場と判断する.
- 閉じる値と移動平均の関係を組み合わせてさらに確認する. 買い信号は,快線がゆっくりとした線を横切って閉じる値が速線より高い場合にのみ発生する. 売り信号は,快線がゆっくりとした線を横切って閉じる値が速線より低い場合にのみ発生する.
- パラロイド線を用いた指数フィルタリング 偽突破. 購入シグナルが最終的に生成されるのは,高速線が遅い線を貫通し,クローズオフ価格が高速線より高く,株価がパラロイド線より高い場合にのみであり,その逆も同様である.
- 最大承受可能な損失に基づいてストップラインを設定する.ATR指標と組み合わせた特定のストップ価格の計算
戦略的優位性
- 移動平均を使って市場の傾向の方向を判断し,明確な方向のない集積市場での頻繁に取引を避ける
- 2つのフィルタリング条件により,よくある偽突破を回避できます.
- ストップ・ストラトジーと組み合わせた単発損失の有効な制御
戦略リスク
- 指数策は誤った信号を生成する
- 通貨リスクは考慮されていません.
- 初期段階の動きが違うかもしれない.
この問題に対する最適化には,以下の方法があります.
- 移動平均のパラメータを最適化して,特定の品種に適したものにします.
- 他の指標またはモデルと組み合わせた信号フィルタリング
- リアルタイムのヘッジまたは自動変換ブローカーアカウントの通貨リスクを考慮する
最適化の方向
- 移動平均のパラメータを最適化してトレンドを把握する
- モデルポートフォリオを増やし,信号の正確性を向上させる
- 複数のタイムサイクルで検証して,騙されないようにする
- ストップ・ローズ戦略の最適化と戦略の安定化
要約する
この戦略は,典型的な2つの移動平均と指標の組み合わせのトレンド追跡戦略に属します. 移動平均の方向を比較して市場の傾向を判断し,複数のフィルタリング指標と組み合わせて偽信号を回避し,取引信号を生成します. 同時に,戦略は,単一損失を制御するストップロスの機能を備えています. 戦略の論理は,シンプルで明確で,容易に理解でき,必要に応じて柔軟に最適化できます. 欠点は,粗略なトレンド判断ツールとして,信号の正確性が向上し,機械学習の高度なモデルなどの導入によって最適化できます.
ストラテジーソースコード
/*backtest
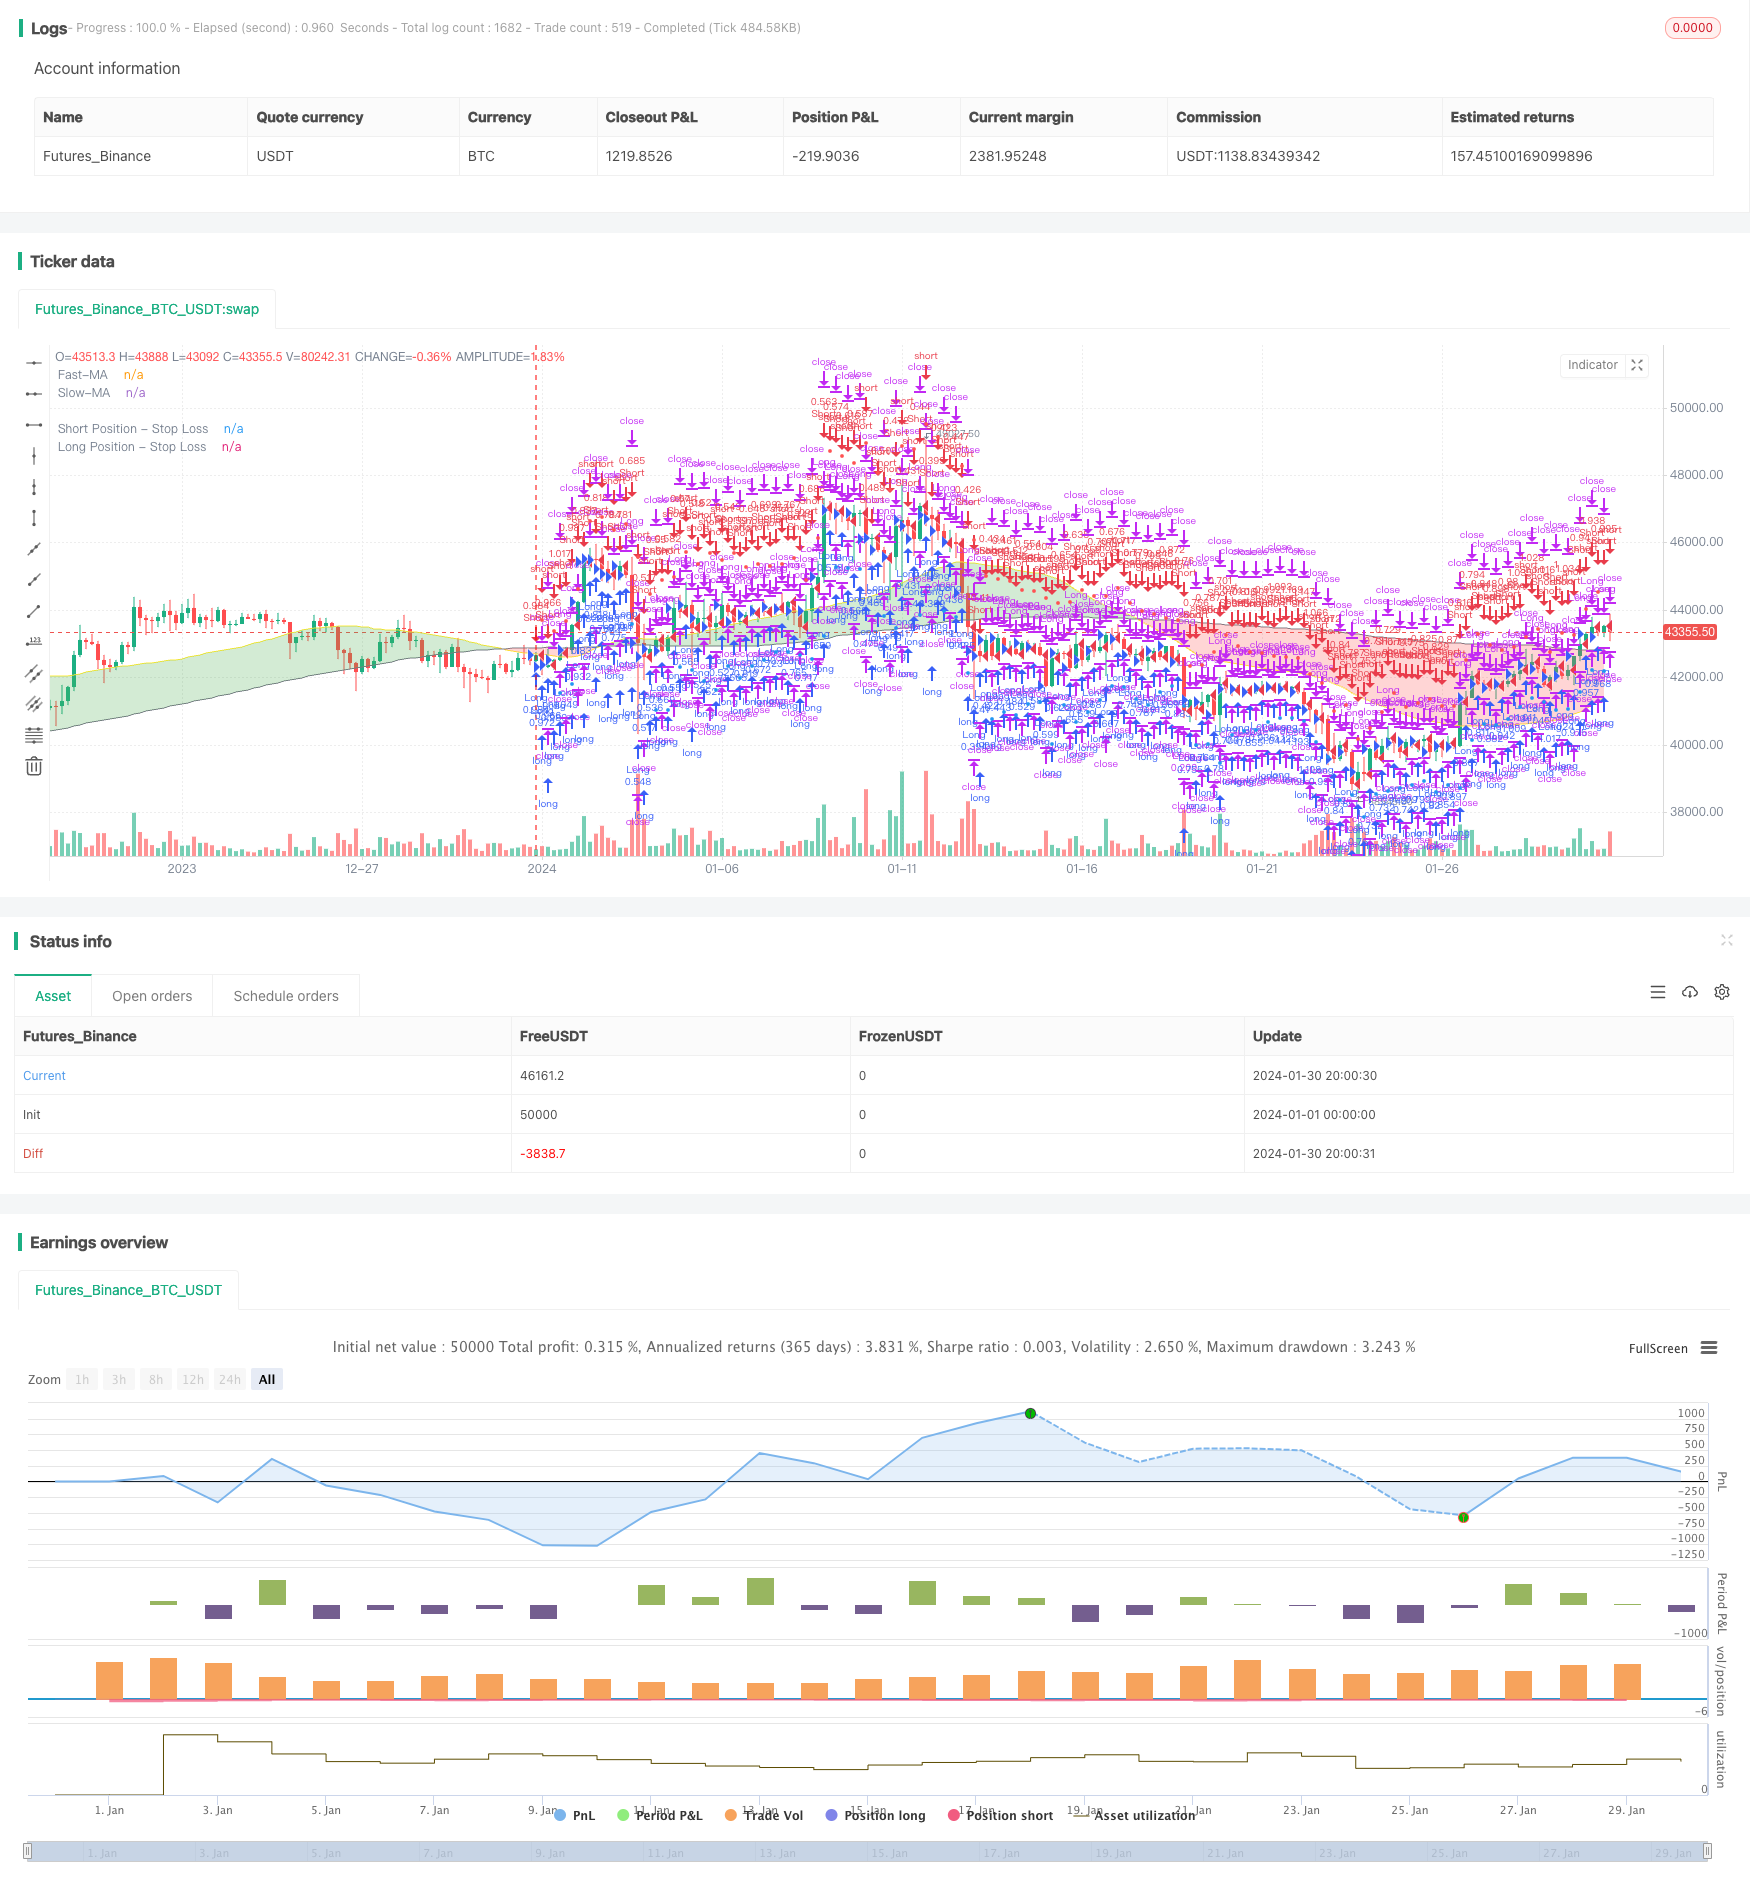
start: 2024-01-01 00:00:00
end: 2024-01-31 00:00:00
period: 4h
basePeriod: 15m
exchanges: [{"eid":"Futures_Binance","currency":"BTC_USDT"}]
*/
// This source code is subject to the terms of the Mozilla Public License 2.0 at https://mozilla.org/MPL/2.0/
// © sosacur01
//@version=5
strategy(title="2 MA | Trend Following", overlay=true, pyramiding=1, commission_type=strategy.commission.percent, commission_value=0.2, initial_capital=10000)
//==========================================
//BACKTEST RANGE
useDateFilter = input.bool(true, title="Filter Date Range of Backtest",
group="Backtest Time Period")
backtestStartDate = input(timestamp("1 jan 2000"),
title="Start Date", group="Backtest Time Period",
tooltip="This start date is in the time zone of the exchange " +
"where the chart's instrument trades. It doesn't use the time " +
"zone of the chart or of your computer.")
backtestEndDate = input(timestamp("1 Jul 2100"),
title="End Date", group="Backtest Time Period",
tooltip="This end date is in the time zone of the exchange " +
"where the chart's instrument trades. It doesn't use the time " +
"zone of the chart or of your computer.")
inTradeWindow = true
if not inTradeWindow and inTradeWindow[1]
strategy.cancel_all()
strategy.close_all(comment="Date Range Exit")
//--------------------------------------
//LONG/SHORT POSITION ON/OFF INPUT
LongPositions = input.bool(title='On/Off Long Postion', defval=true, group="Long & Short Position")
ShortPositions = input.bool(title='On/Off Short Postion', defval=true, group="Long & Short Position")
//---------------------------------------
//SLOW MA INPUTS
averageType1 = input.string(defval="SMA", group="Slow MA Inputs", title="Slow MA Type", options=["SMA", "EMA", "WMA", "HMA", "RMA", "SWMA", "ALMA", "VWMA", "VWAP"])
averageLength1 = input.int(defval=160, group="Slow MA Inputs", title="Slow MA Length", minval=50)
averageSource1 = input(close, title="Slow MA Source", group="Slow MA Inputs")
//SLOW MA TYPE
MovAvgType1(averageType1, averageSource1, averageLength1) =>
switch str.upper(averageType1)
"SMA" => ta.sma(averageSource1, averageLength1)
"EMA" => ta.ema(averageSource1, averageLength1)
"WMA" => ta.wma(averageSource1, averageLength1)
"HMA" => ta.hma(averageSource1, averageLength1)
"RMA" => ta.rma(averageSource1, averageLength1)
"SWMA" => ta.swma(averageSource1)
"ALMA" => ta.alma(averageSource1, averageLength1, 0.85, 6)
"VWMA" => ta.vwma(averageSource1, averageLength1)
"VWAP" => ta.vwap(averageSource1)
=> runtime.error("Moving average type '" + averageType1 +
"' not found!"), na
//----------------------------------
//FAST MA INPUTS
averageType2 = input.string(defval="SMA", group="Fast MA Inputs", title="Fast MA Type", options=["SMA","EMA","WMA","HMA","RMA","SWMA","ALMA","VWMA","VWAP"])
averageLength2 = input.int(defval=40, group="Fast MA Inputs", title="Fast MA Length", maxval=40)
averageSource2 = input(close, title="Fast MA Source", group="Fast MA Inputs")
//FAST MA TYPE
MovAvgType2(averageType2, averageSource2, averageLength2) =>
switch str.upper(averageType2)
"SMA" => ta.sma(averageSource2, averageLength2)
"EMA" => ta.ema(averageSource2, averageLength2)
"WMA" => ta.wma(averageSource2, averageLength2)
"HMA" => ta.hma(averageSource2, averageLength2)
"RMA" => ta.rma(averageSource2, averageLength2)
"SWMA" => ta.swma(averageSource2)
"ALMA" => ta.alma(averageSource2, averageLength2, 0.85, 6)
"VWMA" => ta.vwma(averageSource2, averageLength2)
"VWAP" => ta.vwap(averageSource2)
=> runtime.error("Moving average type '" + averageType2 +
"' not found!"), na
//---------------------------------------------------
//MA VALUES
FASTMA = MovAvgType2(averageType2, averageSource2, averageLength2)
SLOWMA = MovAvgType1(averageType1, averageSource1, averageLength1)
//BUY/SELL TRIGGERS
bullish_trend = FASTMA > SLOWMA and close > FASTMA
bearish_trend = FASTMA < SLOWMA and close < FASTMA
//MAs PLOT
plot1 = plot(SLOWMA,color=color.gray, linewidth=1, title="Slow-MA")
plot2 = plot(FASTMA,color=color.yellow, linewidth=1, title="Fast-MA")
fill(plot1, plot2, color=SLOWMA>FASTMA ? color.new(color.red, 70) : color.new(color.green, 70), title="EMA Clouds")
//-----------------------------------------------------
//PARABOLIC SAR USER INPUT
usepsarFilter = input.bool(title='Use Parabolic Sar?', defval=true, group = "Parabolic SAR Inputs")
psar_display = input.bool(title="Display Parabolic Sar?", defval=false, group="Parabolic SAR Inputs")
start = input.float(title="Start", defval=0.02, group="Parabolic SAR Inputs", step=0.001)
increment = input.float(title="Increment", defval=0.02, group="Parabolic SAR Inputs", step=0.001)
maximum = input.float(title="Maximum", defval=0.2, group="Parabolic SAR Inputs", step=0.001)
//SAR VALUES
psar = request.security(syminfo.tickerid, "D", ta.sar(start, increment, maximum))
//BULLISH & BEARISH PSAR CONDITIONS
bullish_psar = (usepsarFilter ? low > psar : bullish_trend )
bearsish_psar = (usepsarFilter ? high < psar : bearish_trend)
//SAR PLOT
psar_plot = if low > psar
color.rgb(198, 234, 199, 13)
else
color.rgb(219, 134, 134, 48)
plot(psar_display ? psar : na, color=psar_plot, title="Par SAR")
//-------------------------------------
//ENTRIES AND EXITS
long_entry = if inTradeWindow and bullish_trend and bullish_psar and LongPositions
true
long_exit = if inTradeWindow and bearish_trend
true
short_entry = if inTradeWindow and bearish_trend and bearsish_psar and ShortPositions
true
short_exit = if inTradeWindow and bullish_trend
true
//--------------------------------------
//RISK MANAGEMENT - SL, MONEY AT RISK, POSITION SIZING
atrPeriod = input.int(14, "ATR Length", group="Risk Management Inputs")
sl_atr_multiplier = input.float(title="Long Position - Stop Loss - ATR Multiplier", defval=2, group="Risk Management Inputs", step=0.5)
sl_atr_multiplier_short = input.float(title="Short Position - Stop Loss - ATR Multiplier", defval=2, group="Risk Management Inputs", step=0.5)
i_pctStop = input.float(2, title="% of Equity at Risk", step=.5, group="Risk Management Inputs")/100
//ATR VALUE
_atr = ta.atr(atrPeriod)
//CALCULATE LAST ENTRY PRICE
lastEntryPrice = strategy.opentrades.entry_price(strategy.opentrades - 1)
//STOP LOSS - LONG POSITIONS
var float sl = na
//CALCULTE SL WITH ATR AT ENTRY PRICE - LONG POSITION
if (strategy.position_size[1] != strategy.position_size)
sl := lastEntryPrice - (_atr * sl_atr_multiplier)
//IN TRADE - LONG POSITIONS
inTrade = strategy.position_size > 0
//PLOT SL - LONG POSITIONS
plot(inTrade ? sl : na, color=color.blue, style=plot.style_circles, title="Long Position - Stop Loss")
//CALCULATE ORDER SIZE - LONG POSITIONS
positionSize = (strategy.equity * i_pctStop) / (_atr * sl_atr_multiplier)
//============================================================================================
//STOP LOSS - SHORT POSITIONS
var float sl_short = na
//CALCULTE SL WITH ATR AT ENTRY PRICE - SHORT POSITIONS
if (strategy.position_size[1] != strategy.position_size)
sl_short := lastEntryPrice + (_atr * sl_atr_multiplier_short)
//IN TRADE SHORT POSITIONS
inTrade_short = strategy.position_size < 0
//PLOT SL - SHORT POSITIONS
plot(inTrade_short ? sl_short : na, color=color.red, style=plot.style_circles, title="Short Position - Stop Loss")
//CALCULATE ORDER - SHORT POSITIONS
positionSize_short = (strategy.equity * i_pctStop) / (_atr * sl_atr_multiplier_short)
//===============================================
//LONG STRATEGY
strategy.entry("Long", strategy.long, comment="Long", when = long_entry, qty=positionSize)
if (strategy.position_size > 0)
strategy.close("Long", when = (long_exit), comment="Close Long")
strategy.exit("Long", stop = sl, comment="Exit Long")
//SHORT STRATEGY
strategy.entry("Short", strategy.short, comment="Short", when = short_entry, qty=positionSize_short)
if (strategy.position_size < 0)
strategy.close("Short", when = (short_exit), comment="Close Short")
strategy.exit("Short", stop = sl_short, comment="Exit Short")
//ONE DIRECTION TRADING COMMAND (BELLOW ONLY ACTIVATE TO CORRECT BUGS)