EMAと隠れたダイバージェンスに基づくトレンドフォロー戦略
概要
この戦略は,EMA平均線とRSI指標の隠された背離信号に基づいて多頭ポジションを開設し,隠された多頭背離形成の特徴点を識別し,現在の上昇傾向の始まりを判断して,開設シグナルとして位置する. 同時に,EMA平均線とK線の結束価格のEMA平均線の上に位置するゴールドクロスとK線を組み合わせて,トレンドを向上させることができる.この戦略は,中線長さのトレンドを追跡し,盘終結後の再上昇期に多頭ポジションを開設するのに適しています.
戦略原則
EMA平均線策略:50周期と250周期EMA平均線を利用して金色のクロス判断トレンド,価格が50EMAを越えると多頭信号とみなされる.
RSI隠された偏離策:RSI指標は低低点,価格は高低点の隠された多頭偏離信号が現れ,反転の開始を予告する. 限定された偏離点の数を配合して,偽信号をフィルターすることができる.
K線閉店戦略:K線閉店価格が50EMAを超えるとポジションを開く.
この3つの戦略を総合して,トレンドが上昇し始め,多ポジションを始めるように判断します.
優位分析
EMA平均線を使用してトレンドの方向を判断し,RSI指標の反転信号と連携し,トレンドの開始段階でポジションを開くことができます.
双重確認メカニズムは,EMA,RSI,K線の閉盘価格の組み合わせの判断を使用して,偽信号を効果的にフィルターします.
中長線トレンドを追跡し,新上昇トレンドの開始を判断するのに適している.
リスク分析
EMA均線がデッドフォークを生じると,適時平仓が必要である.
RSIは隠れた信号から判断するには,ある程度の経験が必要で,パラメータを正しく設定しない場合,信号を逃すか判断を誤る可能性があります.
取引品種のパラメータは最適化設定が必要です.
最適化の方向
EMA平均線のパラメータを動的に調整し,トレンド判断の精度を最適化します.
RSIパラメータを調整し,隠された偏差の判断の精度を最適化します.
ATRの停止またはパーセンテージの停止などの方法でリスクを制御する.
空頭取引戦略を開発し,その戦略により,下向きのトレンドで空頭空頭ポジションを開くことができる.
要約する
この戦略は,EMA平均線を総合的に使って大トレンドを判断し,RSI指標と組み合わせて判断精度を高め,収束終了後に新しい上昇トレンドを判断し始める.これは,より保守的なトレンド追跡戦略である.パラメータの最適化設定とストップ・ストップ手段の追加により,よりよい効果を得ることができる.単純な移動平均戦略と比較して,上昇トレンドの判断精度は高く,勝率も高く,実用型戦略である.
/*backtest
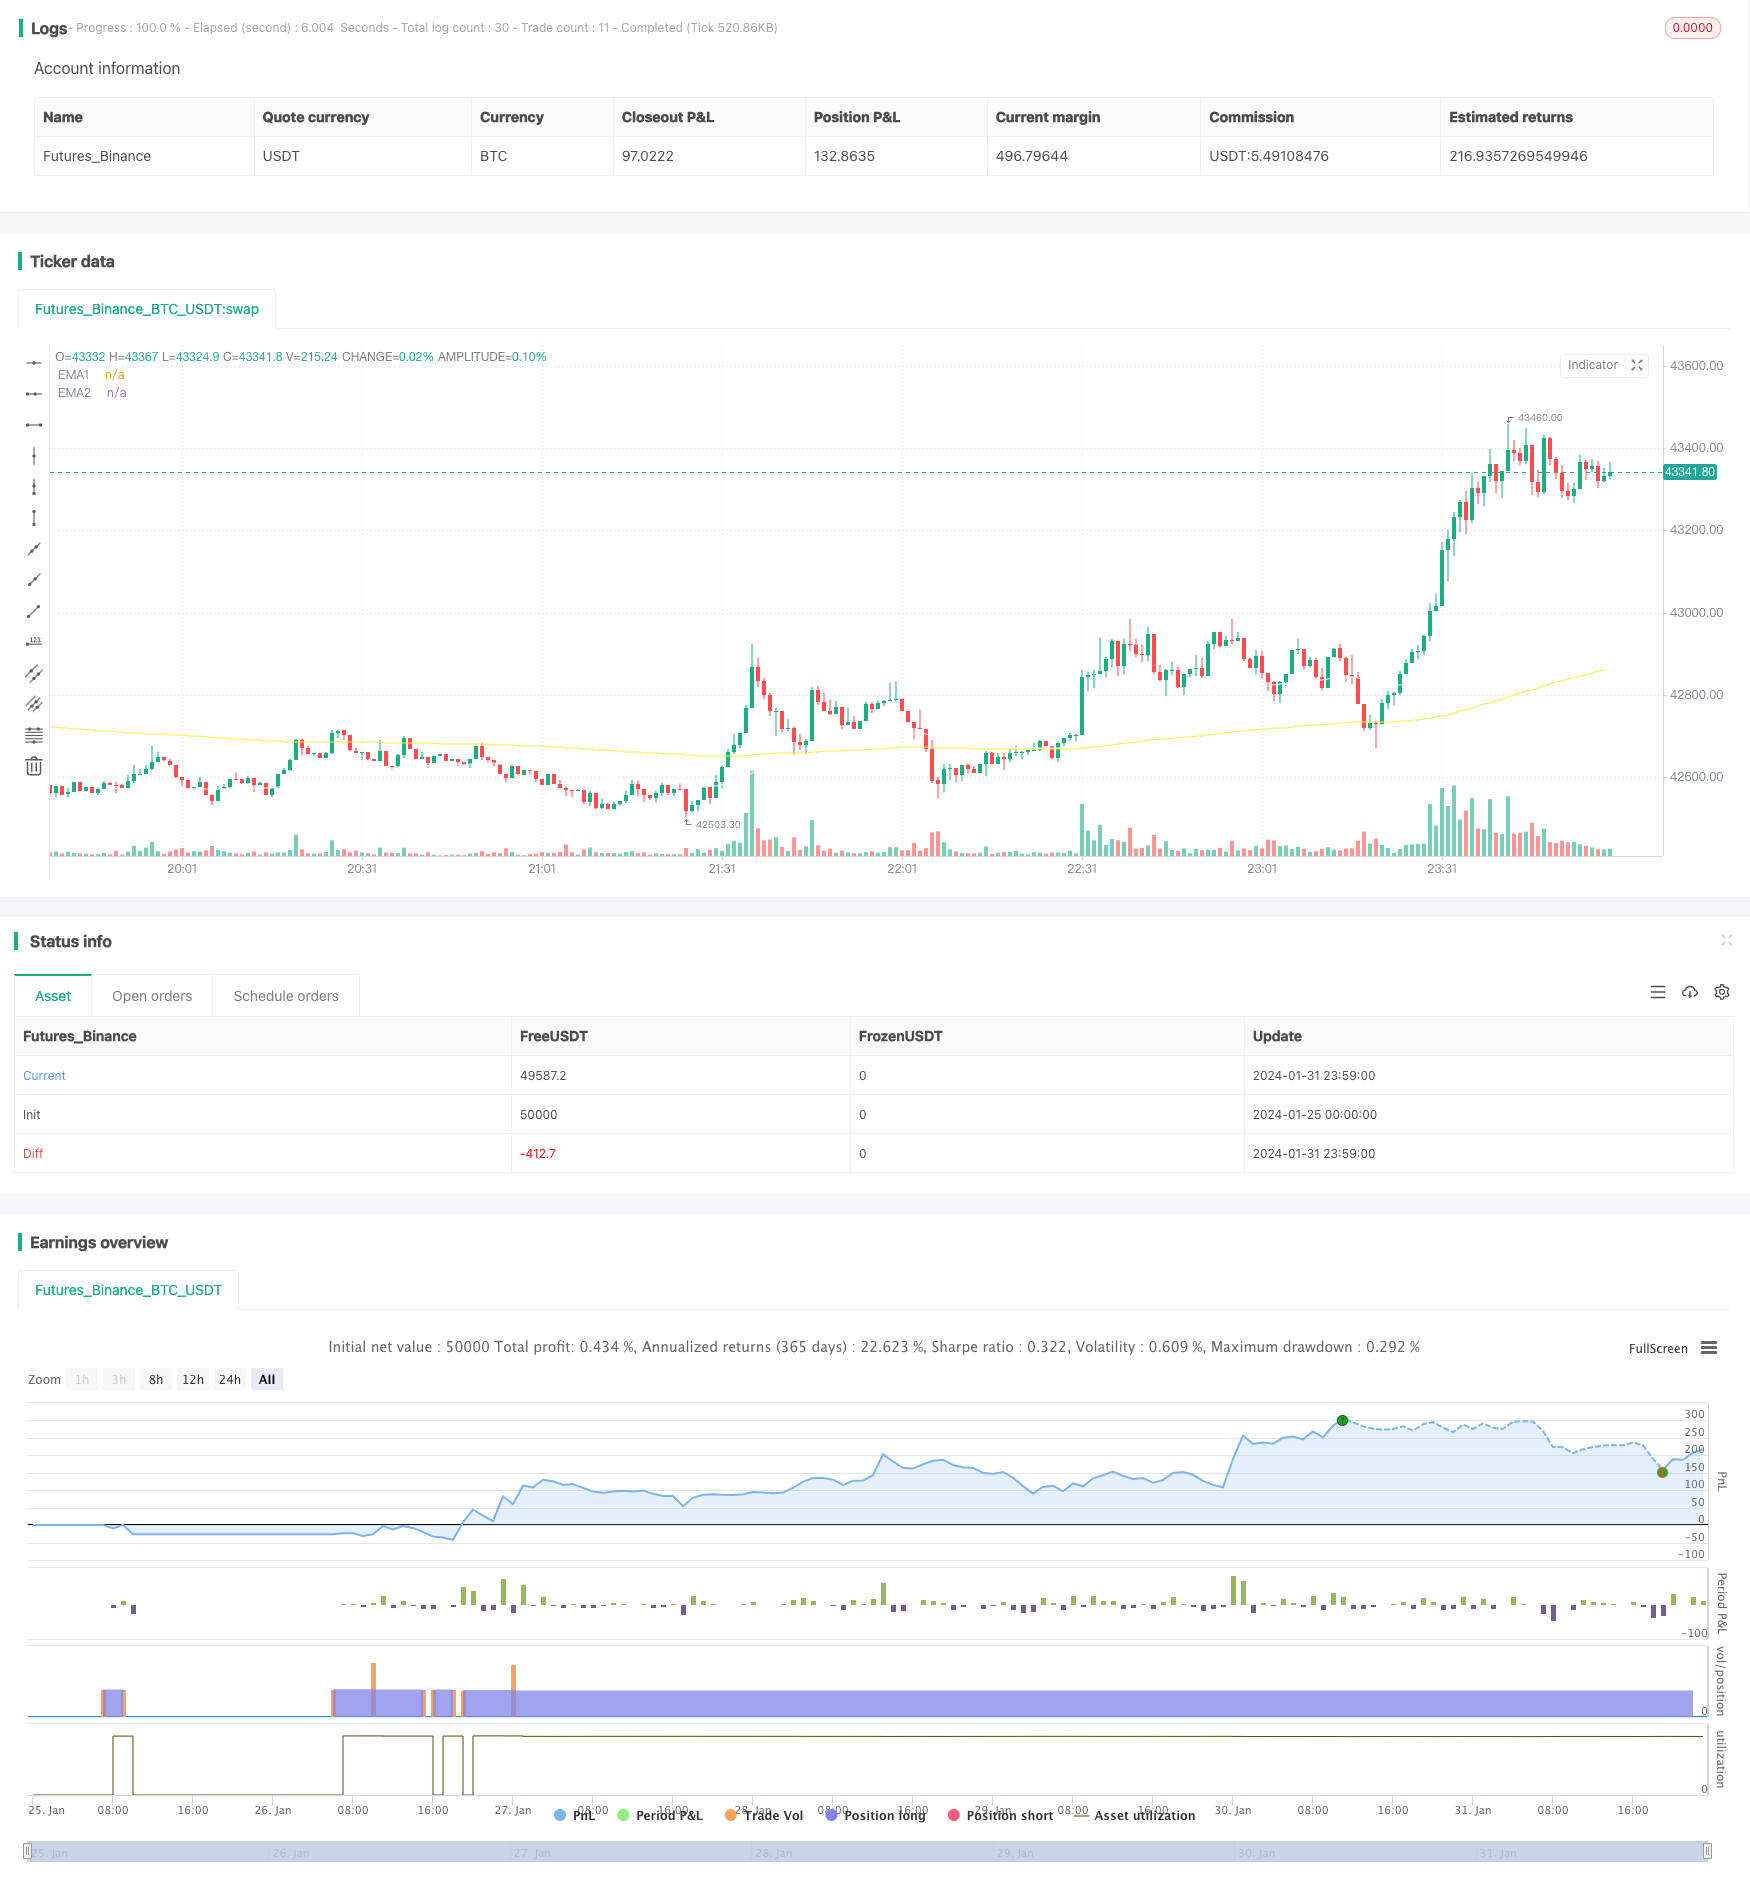
start: 2024-01-25 00:00:00
end: 2024-02-01 00:00:00
period: 1m
basePeriod: 1m
exchanges: [{"eid":"Futures_Binance","currency":"BTC_USDT"}]
*/
//@version=4
strategy(title="EMA RSI ATR Hidden Div Strat", shorttitle="Hidden Div Strat", overlay = true, pyramiding = 0, max_bars_back=3000, calc_on_order_fills = false, commission_type = strategy.commission.percent, commission_value = 0, default_qty_type = strategy.percent_of_equity, default_qty_value = 10, initial_capital=5000, currency=currency.USD)
// Time Range
FromMonth=input(defval=1,title="FromMonth",minval=1,maxval=12)
FromDay=input(defval=1,title="FromDay",minval=1,maxval=31)
FromYear=input(defval=2020,title="FromYear",minval=2016)
ToMonth=input(defval=1,title="ToMonth",minval=1,maxval=12)
ToDay=input(defval=1,title="ToDay",minval=1,maxval=31)
ToYear=input(defval=9999,title="ToYear",minval=2017)
start=timestamp(FromYear,FromMonth,FromDay,00,00)
finish=timestamp(ToYear,ToMonth,ToDay,23,59)
window()=>true
// Bar's time happened on/after start date?
afterStartDate = time >= start and time<=finish?true:false
//EMA'S
emasrc = close
len1 = input(50, minval=1, title="EMA1")
ema1 = ema(emasrc, len1)
col1 = color.white
len2 = input(250, minval=1, title="EMA2")
ema2 = ema(emasrc, len2)
col2 = color.yellow
//Plots
plot(ema1, title="EMA1", linewidth=1, color=col1)
plot(ema2, title="EMA2", linewidth=1, color=col2)
//Stoch
periodK = input(4, title="K", minval=1)
periodD = input(4, title="D", minval=1)
smoothK = input(3, title="Smooth", minval=1)
k = sma(stoch(close, high, low, periodK), smoothK)
d = sma(k, periodD)
//Hidden Divergence Indikator
len = input(title="RSI Period", minval=1, defval=14)
src = input(title="RSI Source", defval=close)
lbR = input(title="Pivot Lookback Right", defval=1)
lbL = input(title="Pivot Lookback Left", defval=19)
rangeUpper = input(title="Max of Lookback Range", defval=20)
rangeLower = input(title="Min of Lookback Range", defval=4)
hiddenBullColor = color.new(color.green, 80)
textColor = color.white
noneColor = color.new(color.white, 100)
osc = rsi(src, len)
plFound = na(pivotlow(osc, lbL, lbR)) ? false : true
phFound = na(pivothigh(osc, lbL, lbR)) ? false : true
_inRange(cond) =>
bars = barssince(cond == true)
rangeLower <= bars and bars <= rangeUpper
//------------------------------------------------------------------------------
// Hidden Bullish
// Osc: Lower Low
oscLL = osc[lbR] < valuewhen(plFound, osc[lbR], 1) and _inRange(plFound[1])
// Price: Higher Low
priceHL = low[lbR] > valuewhen(plFound, low[lbR], 1)
hiddenBullCond = priceHL and oscLL and plFound
//buy Conditions
buyhiddenbull = hiddenBullCond[1] or hiddenBullCond[2] or hiddenBullCond[3] or hiddenBullCond[4] or hiddenBullCond[5] or hiddenBullCond[6] or hiddenBullCond[7] or hiddenBullCond[8] or hiddenBullCond[9] or hiddenBullCond[10]
emacondition = ema1 > ema2
upcondition = close[1] > ema1[1] and ema2[1] and close[2] > ema1[2] and ema2[2] and close[3] > ema1[3] and ema2[3]
crossup = k[0] >= d[0] and k[1] <= d[1]
longcondition = emacondition and upcondition and crossup and buyhiddenbull
if (afterStartDate)
strategy.entry("Long", strategy.long, when = longcondition)
//TakeProfit, StopLoss lowest low
profitfactor = input(title="Profitfactor", type=input.float, step=0.1, defval=1.6)
loLen = input(title="Lowest Low Lookback", type=input.integer,
defval=38, minval=2)
stop_level = lowest(low, loLen)[1]
bought = strategy.position_size[1] < strategy.position_size
barsbought = barssince(bought)
if strategy.position_size>0
profit_level = strategy.position_avg_price + ((strategy.position_avg_price - stop_level[barsbought])*profitfactor)
strategy.exit(id="TP/ SL", stop=stop_level[barsbought], limit=profit_level)