価格乖離に基づくトレンド取引戦略
作成日:
2024-02-02 18:00:55
最終変更日:
2024-02-02 18:00:55
コピー:
2
クリック数:
844
1
フォロー
1750
フォロワー
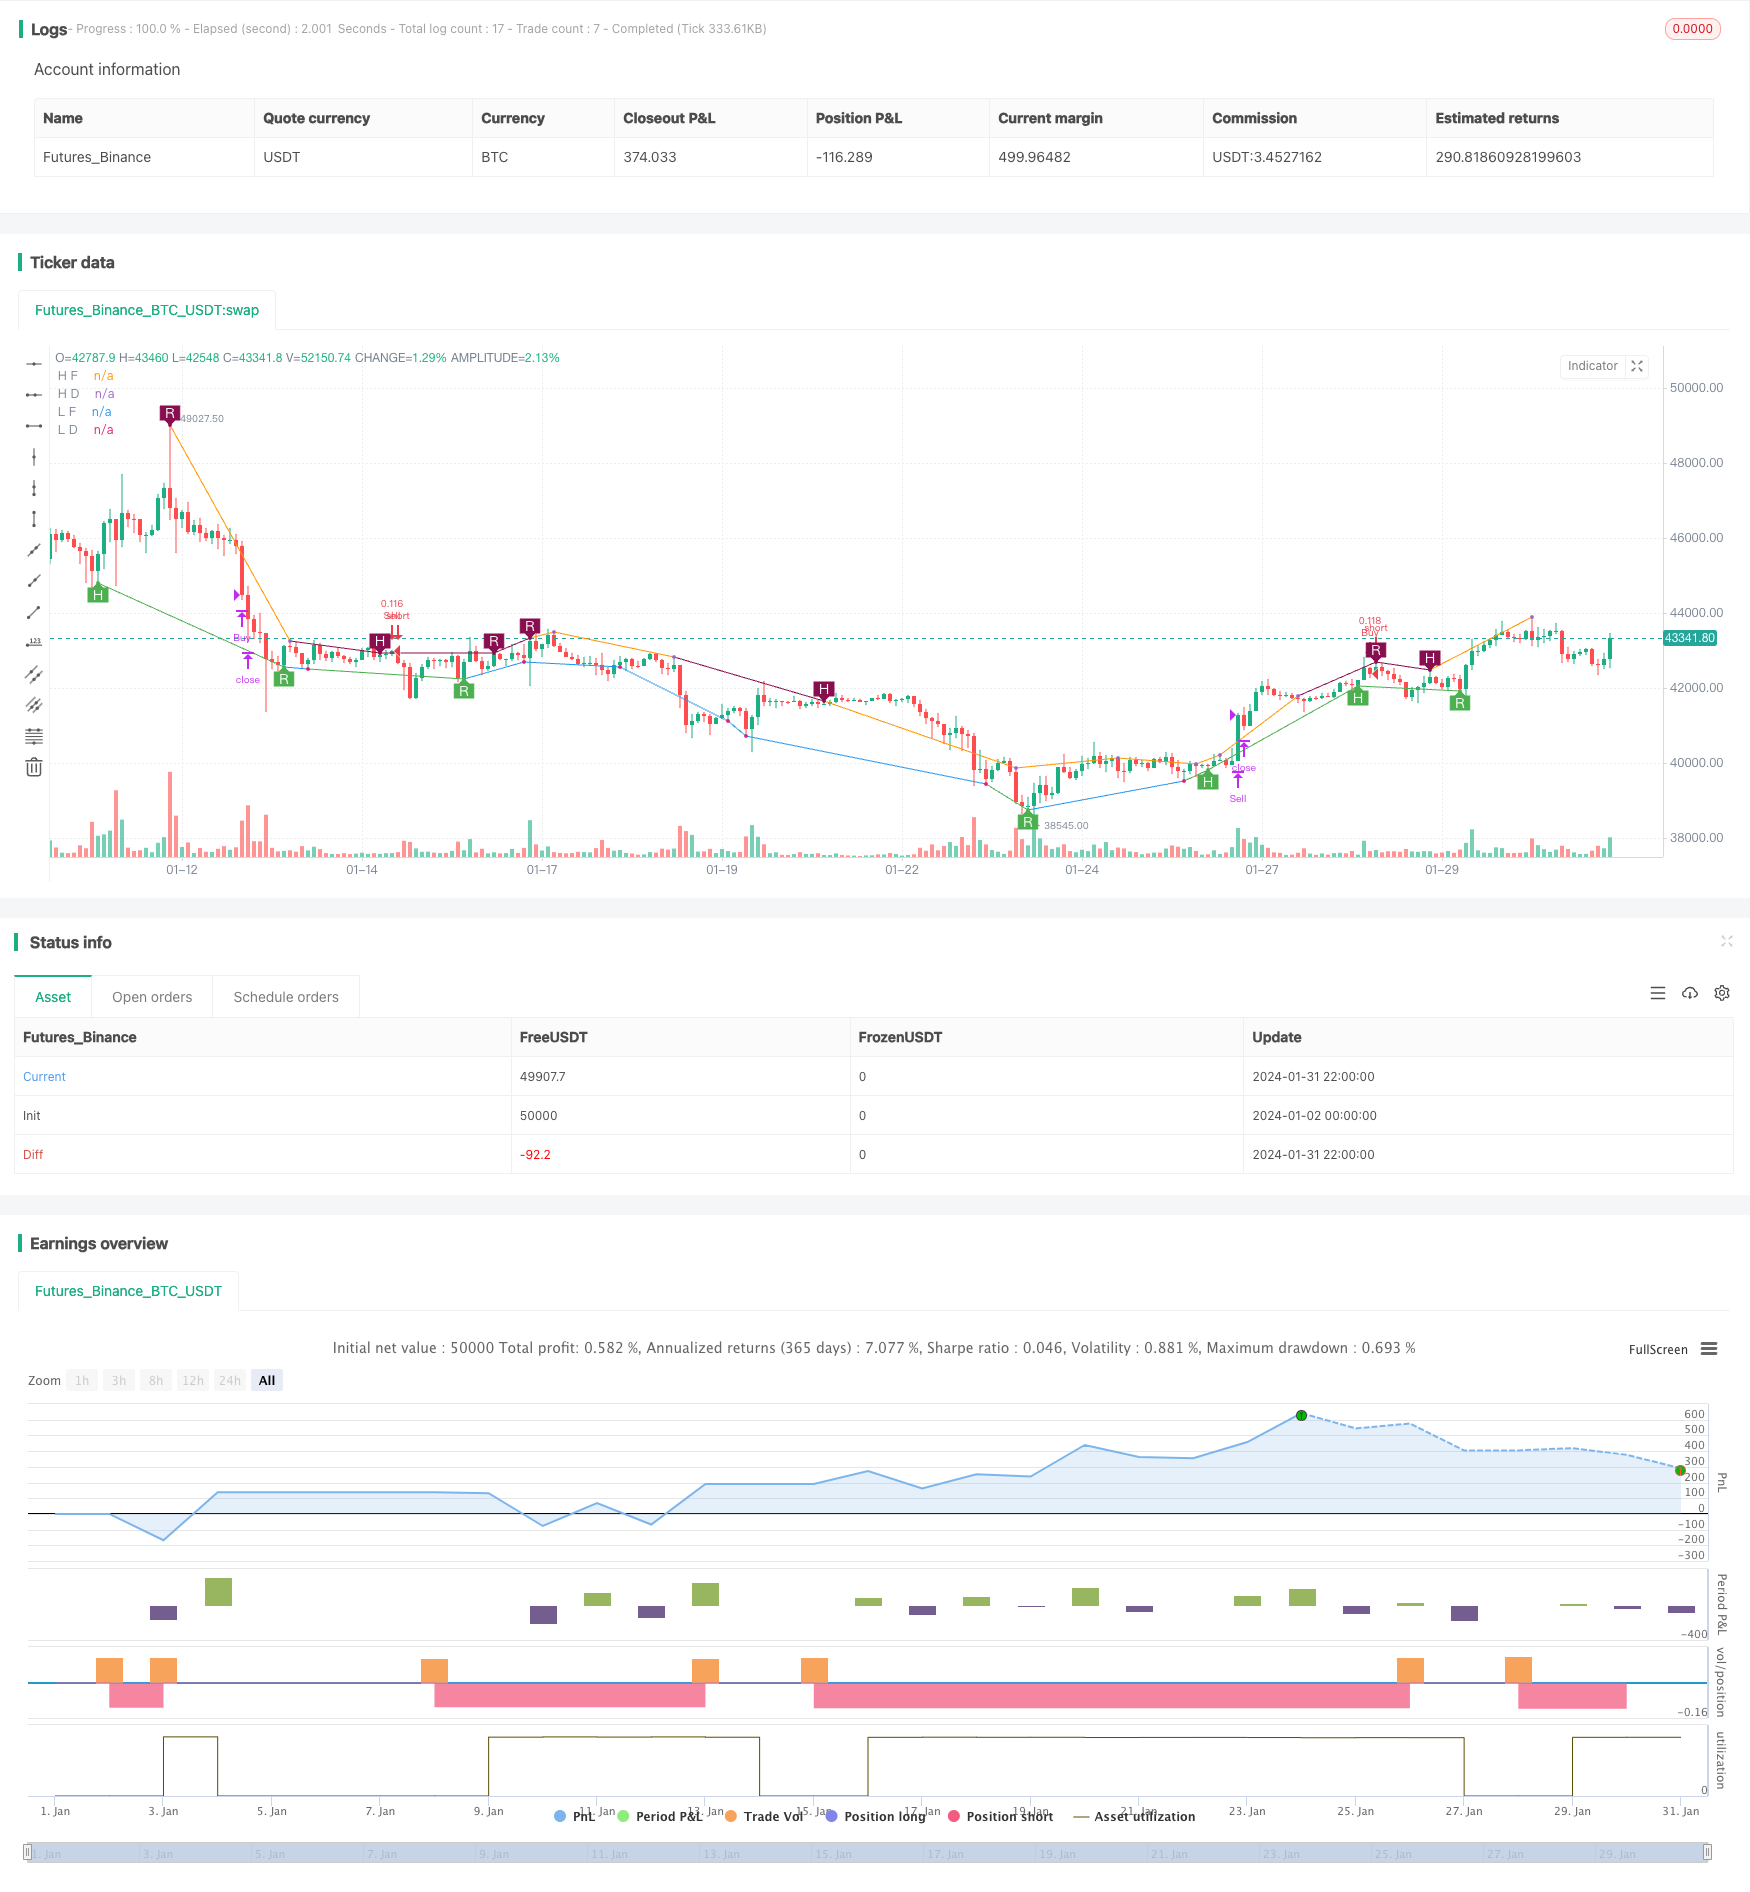
概要
この戦略は,価格の散乱信号に基づくトレンド取引戦略である.これは,RSI,MACD,Stochasticsなどの複数の指標を使用して,価格の散乱信号を検出し,Murrey Mathの振動器によって確認される.価格の散乱信号が表示されると,振動器が現在のトレンド方向を確認した場合,入場する.
戦略原則
この戦略の核心は,価格の散布理論である.価格が創新高だが指標は創新高でないとき,熊市価格の散布と呼ばれている.価格が創新低だが指標は創新低でないとき,牛市価格の散布と呼ばれている.これは,トレンドが逆転する可能性を示している.戦略は,上下型を振動器と組み合わせて確認取引信号を使用している.
具体的には,入場条件は以下の通りです.
- 通常の散布と隠された散布を含む価格散布シグナルを検出する
- この振動器は,相応のトレンド領域内にあります.
出場条件は,振動器が中線を回転した時に平仓である.
優位分析
この戦略は,価格散布理論とトレンド確認を組み合わせ,以下の利点があります.
- 価格の散発信号を利用して潜在的トレンド転換点を検出する.
- アップルの振動器は,現在のトレンドを確認し,偽の突破を回避します.
- 複数の指標とパラメータの組み合わせで柔軟に調整できます.
- トレンド追跡と損失防止
- 論理のルールが明確で,コードの最適化スペースが広い.
リスク分析
リスクは以下の通りです.
- 価格の散布信号は偽信号であり,トレンドの逆転を完全に確認することはできません.
- 振動器のパラメータの不適切な設定は,漏洩と逃した取引の機会につながる可能性があります.
- 多空のポジションの過度の傾きは,大きな損失のリスクを伴う
- 取引数やスライドポイントのコストが急上昇する可能性があります.
リスクの軽減のために,ストップを設定し,ポジションを調整し,パラメータの組み合わせを最適化することをお勧めします.
最適化の方向
この戦略はさらに改善できる余地があります.
- 機械学習のアルゴリズムを追加し,パラメータ群をリアルタイムで最適化
- 自動ストップ技術,トラッキングストップ,平均ストップなどの追加
- より多くの指標とフィルタリング条件を組み合わせて,通信ノイズ比率を向上させる
- 動的に振動器のパラメータを調整し,トレンド判断を最適化
- リスク管理の最適化,最大回収制限の設定など
要約する
この戦略は,価格分散理論とトレンド分析指標を統合し,潜在的トレンド転換点を効果的に発見します.最適化されたリスク管理措置と組み合わせて,優れた戦略のリターン率を得ることができます.将来,機械学習などの高度な方法を使用して最適化することができ,より安定した余剰利益を得ることができます.
ストラテジーソースコード
/*backtest
start: 2024-01-02 00:00:00
end: 2024-02-01 00:00:00
period: 2h
basePeriod: 15m
exchanges: [{"eid":"Futures_Binance","currency":"BTC_USDT"}]
*/

//@version=2
//
// Title:   [STRATEGY][UL]Price Divergence Strategy V1
// Author:  JustUncleL
// Date:    23-Oct-2016
// Version: v1.0
//
// Description:
//  A trend trading strategy the uses Price Divergence detection signals, that
//  are confirmed by the "Murrey's Math Oscillator" (Donchanin Channel based).
//
//  *** USE AT YOUR OWN RISK ***
//
// Mofidifications:
//  1.0 - original
//
// References:
//  Strategy Based on:
//  - [RS]Price Divergence Detector V2 by RicardoSantos
//  - UCS_Murrey's Math Oscillator by Ucsgears
//  Some Code borrowed from:
//  - "Strategy Code Example by JayRogers"
//  Information on Divergence Trading:
//  - http://www.babypips.com/school/high-school/trading-divergences
//
strategy(title='[STRATEGY][UL]Price Divergence Strategy v1.0', pyramiding=0, overlay=true, initial_capital=10000, calc_on_every_tick=false,
         currency=currency.USD,default_qty_type=strategy.percent_of_equity,default_qty_value=10)
//  ||  General Input:
method = input(title='Method (0=rsi, 1=macd, 2=stoch, 3=volume, 4=acc/dist, 5=fisher, 6=cci):',  defval=1, minval=0, maxval=6)
SHOW_LABEL = input(title='Show Labels', type=bool, defval=true)
SHOW_CHANNEL = input(title='Show Channel', type=bool, defval=false)
uHid = input(true,title="Use Hidden Divergence in Strategy")
uReg = input(true,title="Use Regular Divergence in Strategy")
//  ||  RSI / STOCH / VOLUME / ACC/DIST Input:
rsi_smooth = input(title='RSI/STOCH/Volume/ACC-DIST/Fisher/cci Smooth:',  defval=5)
//  ||  MACD Input:
macd_src = input(title='MACD Source:', defval=close)
macd_fast = input(title='MACD Fast:',  defval=12)
macd_slow = input(title='MACD Slow:',  defval=26)
macd_smooth = input(title='MACD Smooth Signal:',  defval=9)
//  ||  Functions:
f_top_fractal(_src)=>_src[4] < _src[2] and _src[3] < _src[2] and _src[2] > _src[1] and _src[2] > _src[0]
f_bot_fractal(_src)=>_src[4] > _src[2] and _src[3] > _src[2] and _src[2] < _src[1] and _src[2] < _src[0]
f_fractalize(_src)=>f_top_fractal(_src) ? 1 : f_bot_fractal(_src) ? -1 : 0

//  ||••>   START MACD FUNCTION
f_macd(_src, _fast, _slow, _smooth)=>
    _fast_ma = sma(_src, _fast)
    _slow_ma = sma(_src, _slow)
    _macd = _fast_ma-_slow_ma
    _signal = ema(_macd, _smooth)
    _hist = _macd - _signal
//  ||<••   END MACD FUNCTION

//  ||••>   START ACC/DIST FUNCTION
f_accdist(_smooth)=>_return=sma(cum(close==high and close==low or high==low ? 0 : ((2*close-low-high)/(high-low))*volume), _smooth)
//  ||<••   END ACC/DIST FUNCTION

//  ||••>   START FISHER FUNCTION
f_fisher(_src, _window)=>
    _h = highest(_src, _window)
    _l = lowest(_src, _window)
    _value0 = .66 * ((_src - _l) / max(_h - _l, .001) - .5) + .67 * nz(_value0[1])
    _value1 = _value0 > .99 ? .999 : _value0 < -.99 ? -.999 : _value0
    _fisher = .5 * log((1 + _value1) / max(1 - _value1, .001)) + .5 * nz(_fisher[1])
//  ||<••   END FISHER FUNCTION

method_high = method == 0 ? rsi(high, rsi_smooth) :
  method == 1 ? f_macd(macd_src, macd_fast, macd_slow, macd_smooth) :
  method == 2 ? stoch(close, high, low, rsi_smooth) :
  method == 3 ? sma(volume, rsi_smooth) :
  method == 4 ? f_accdist(rsi_smooth) :
  method == 5 ? f_fisher(high, rsi_smooth) :
  method == 6 ? cci(high, rsi_smooth) :
  na

method_low = method == 0 ? rsi(low, rsi_smooth) :
  method == 1 ? f_macd(macd_src, macd_fast, macd_slow, macd_smooth) :
  method == 2 ? stoch(close, high, low, rsi_smooth) :
  method == 3 ? sma(volume, rsi_smooth) :
  method == 4 ? f_accdist(rsi_smooth) :
  method == 5 ? f_fisher(low, rsi_smooth) :
  method == 6 ? cci(low, rsi_smooth) :
  na

fractal_top = f_fractalize(method_high) > 0 ? method_high[2] : na
fractal_bot = f_fractalize(method_low) < 0 ? method_low[2] : na

high_prev = valuewhen(fractal_top, method_high[2], 1)
high_price = valuewhen(fractal_top, high[2], 1)
low_prev = valuewhen(fractal_bot, method_low[2], 1)
low_price = valuewhen(fractal_bot, low[2], 1)

regular_bearish_div = fractal_top and high[2] > high_price and method_high[2] < high_prev
hidden_bearish_div = fractal_top and high[2] < high_price and method_high[2] > high_prev
regular_bullish_div = fractal_bot and low[2] < low_price and method_low[2] > low_prev
hidden_bullish_div = fractal_bot and low[2] > low_price and method_low[2] < low_prev

plot(title='H F', series=fractal_top ? high[2] : na, color=regular_bearish_div or hidden_bearish_div ? maroon : not SHOW_CHANNEL ? na : silver, offset=-2)
plot(title='L F', series=fractal_bot ? low[2] : na, color=regular_bullish_div or hidden_bullish_div ? green : not SHOW_CHANNEL ? na : silver, offset=-2)
plot(title='H D', series=fractal_top ? high[2] : na, style=circles, color=regular_bearish_div or hidden_bearish_div ? maroon : not SHOW_CHANNEL ? na : silver, linewidth=3, offset=-2)
plot(title='L D', series=fractal_bot ? low[2] : na, style=circles, color=regular_bullish_div or hidden_bullish_div ? green : not SHOW_CHANNEL ? na : silver, linewidth=3, offset=-2)

plotshape(title='+RBD', series=not SHOW_LABEL ? na : regular_bearish_div ? high[2] : na, text='R', style=shape.labeldown, location=location.absolute, color=maroon, textcolor=white, offset=-2)
plotshape(title='+HBD', series=not SHOW_LABEL ? na : hidden_bearish_div ? high[2] : na, text='H', style=shape.labeldown, location=location.absolute, color=maroon, textcolor=white, offset=-2)
plotshape(title='-RBD', series=not SHOW_LABEL ? na : regular_bullish_div ? low[2] : na, text='R', style=shape.labelup, location=location.absolute, color=green, textcolor=white, offset=-2)
plotshape(title='-HBD', series=not SHOW_LABEL ? na : hidden_bullish_div ? low[2] : na, text='H', style=shape.labelup, location=location.absolute, color=green, textcolor=white, offset=-2)

// Code borrowed from UCS_Murrey's Math Oscillator by Ucsgears
//  - UCS_MMLO
// Inputs
length = input(100, minval = 10, title = "MMLO Look back Length")
quad   = input(2, minval = 1, maxval = 4, step = 1, title = "Mininum Quadrant for MMLO Support")
mult = 0.125

// Donchanin Channel
hi = highest(high, length)
lo = lowest(low, length)
range = hi - lo
multiplier = (range) * mult
midline = lo + multiplier * 4

oscillator = (close - midline)/(range/2)

a = oscillator > 0
b = oscillator > 0 and oscillator > mult*2
c = oscillator > 0 and oscillator > mult*4
d = oscillator > 0 and oscillator > mult*6

z = oscillator < 0
y = oscillator < 0 and oscillator < -mult*2
x = oscillator < 0 and oscillator < -mult*4
w = oscillator < 0 and oscillator < -mult*6


//  Strategy: (Thanks to JayRogers)
// === STRATEGY RELATED INPUTS ===
//tradeInvert     = input(defval = false, title = "Invert Trade Direction?")
// the risk management inputs
inpTakeProfit   = input(defval = 0, title = "Take Profit Points", minval = 0)
inpStopLoss     = input(defval = 0, title = "Stop Loss Points", minval = 0)
inpTrailStop    = input(defval = 100, title = "Trailing Stop Loss Points", minval = 0)
inpTrailOffset  = input(defval = 0, title = "Trailing Stop Loss Offset Points", minval = 0)

// === RISK MANAGEMENT VALUE PREP ===
// if an input is less than 1, assuming not wanted so we assign 'na' value to disable it.
useTakeProfit   = inpTakeProfit  >= 1 ? inpTakeProfit  : na
useStopLoss     = inpStopLoss    >= 1 ? inpStopLoss    : na
useTrailStop    = inpTrailStop   >= 1 ? inpTrailStop   : na
useTrailOffset  = inpTrailOffset >= 1 ? inpTrailOffset : na

// === STRATEGY - LONG POSITION EXECUTION ===
enterLong() => ((uReg and regular_bullish_div) or (uHid and hidden_bullish_div)) and (quad==1? a[1]: quad==2?b[1]: quad==3?c[1]: quad==4?d[1]: false)// functions can be used to wrap up and work out complex conditions
exitLong() => oscillator <= 0
strategy.entry(id = "Buy", long = true, when = enterLong() )// use function or simple condition to decide when to get in
strategy.close(id = "Buy", when = exitLong() )// ...and when to get out

// === STRATEGY - SHORT POSITION EXECUTION ===
enterShort() => ((uReg and regular_bearish_div) or (uHid and hidden_bearish_div)) and (quad==1? z[1]: quad==2?y[1]: quad==3?x[1]: quad==4?w[1]: false)
exitShort() => oscillator >= 0
strategy.entry(id = "Sell", long = false, when = enterShort())
strategy.close(id = "Sell", when = exitShort() )

// === STRATEGY RISK MANAGEMENT EXECUTION ===
// finally, make use of all the earlier values we got prepped
strategy.exit("Exit Buy", from_entry = "Buy", profit = useTakeProfit, loss = useStopLoss, trail_points = useTrailStop, trail_offset = useTrailOffset)
strategy.exit("Exit Sell", from_entry = "Sell", profit = useTakeProfit, loss = useStopLoss, trail_points = useTrailStop, trail_offset = useTrailOffset)


//EOF