ドンチャンチャネル指標に基づいて開発された定量取引戦略
概要
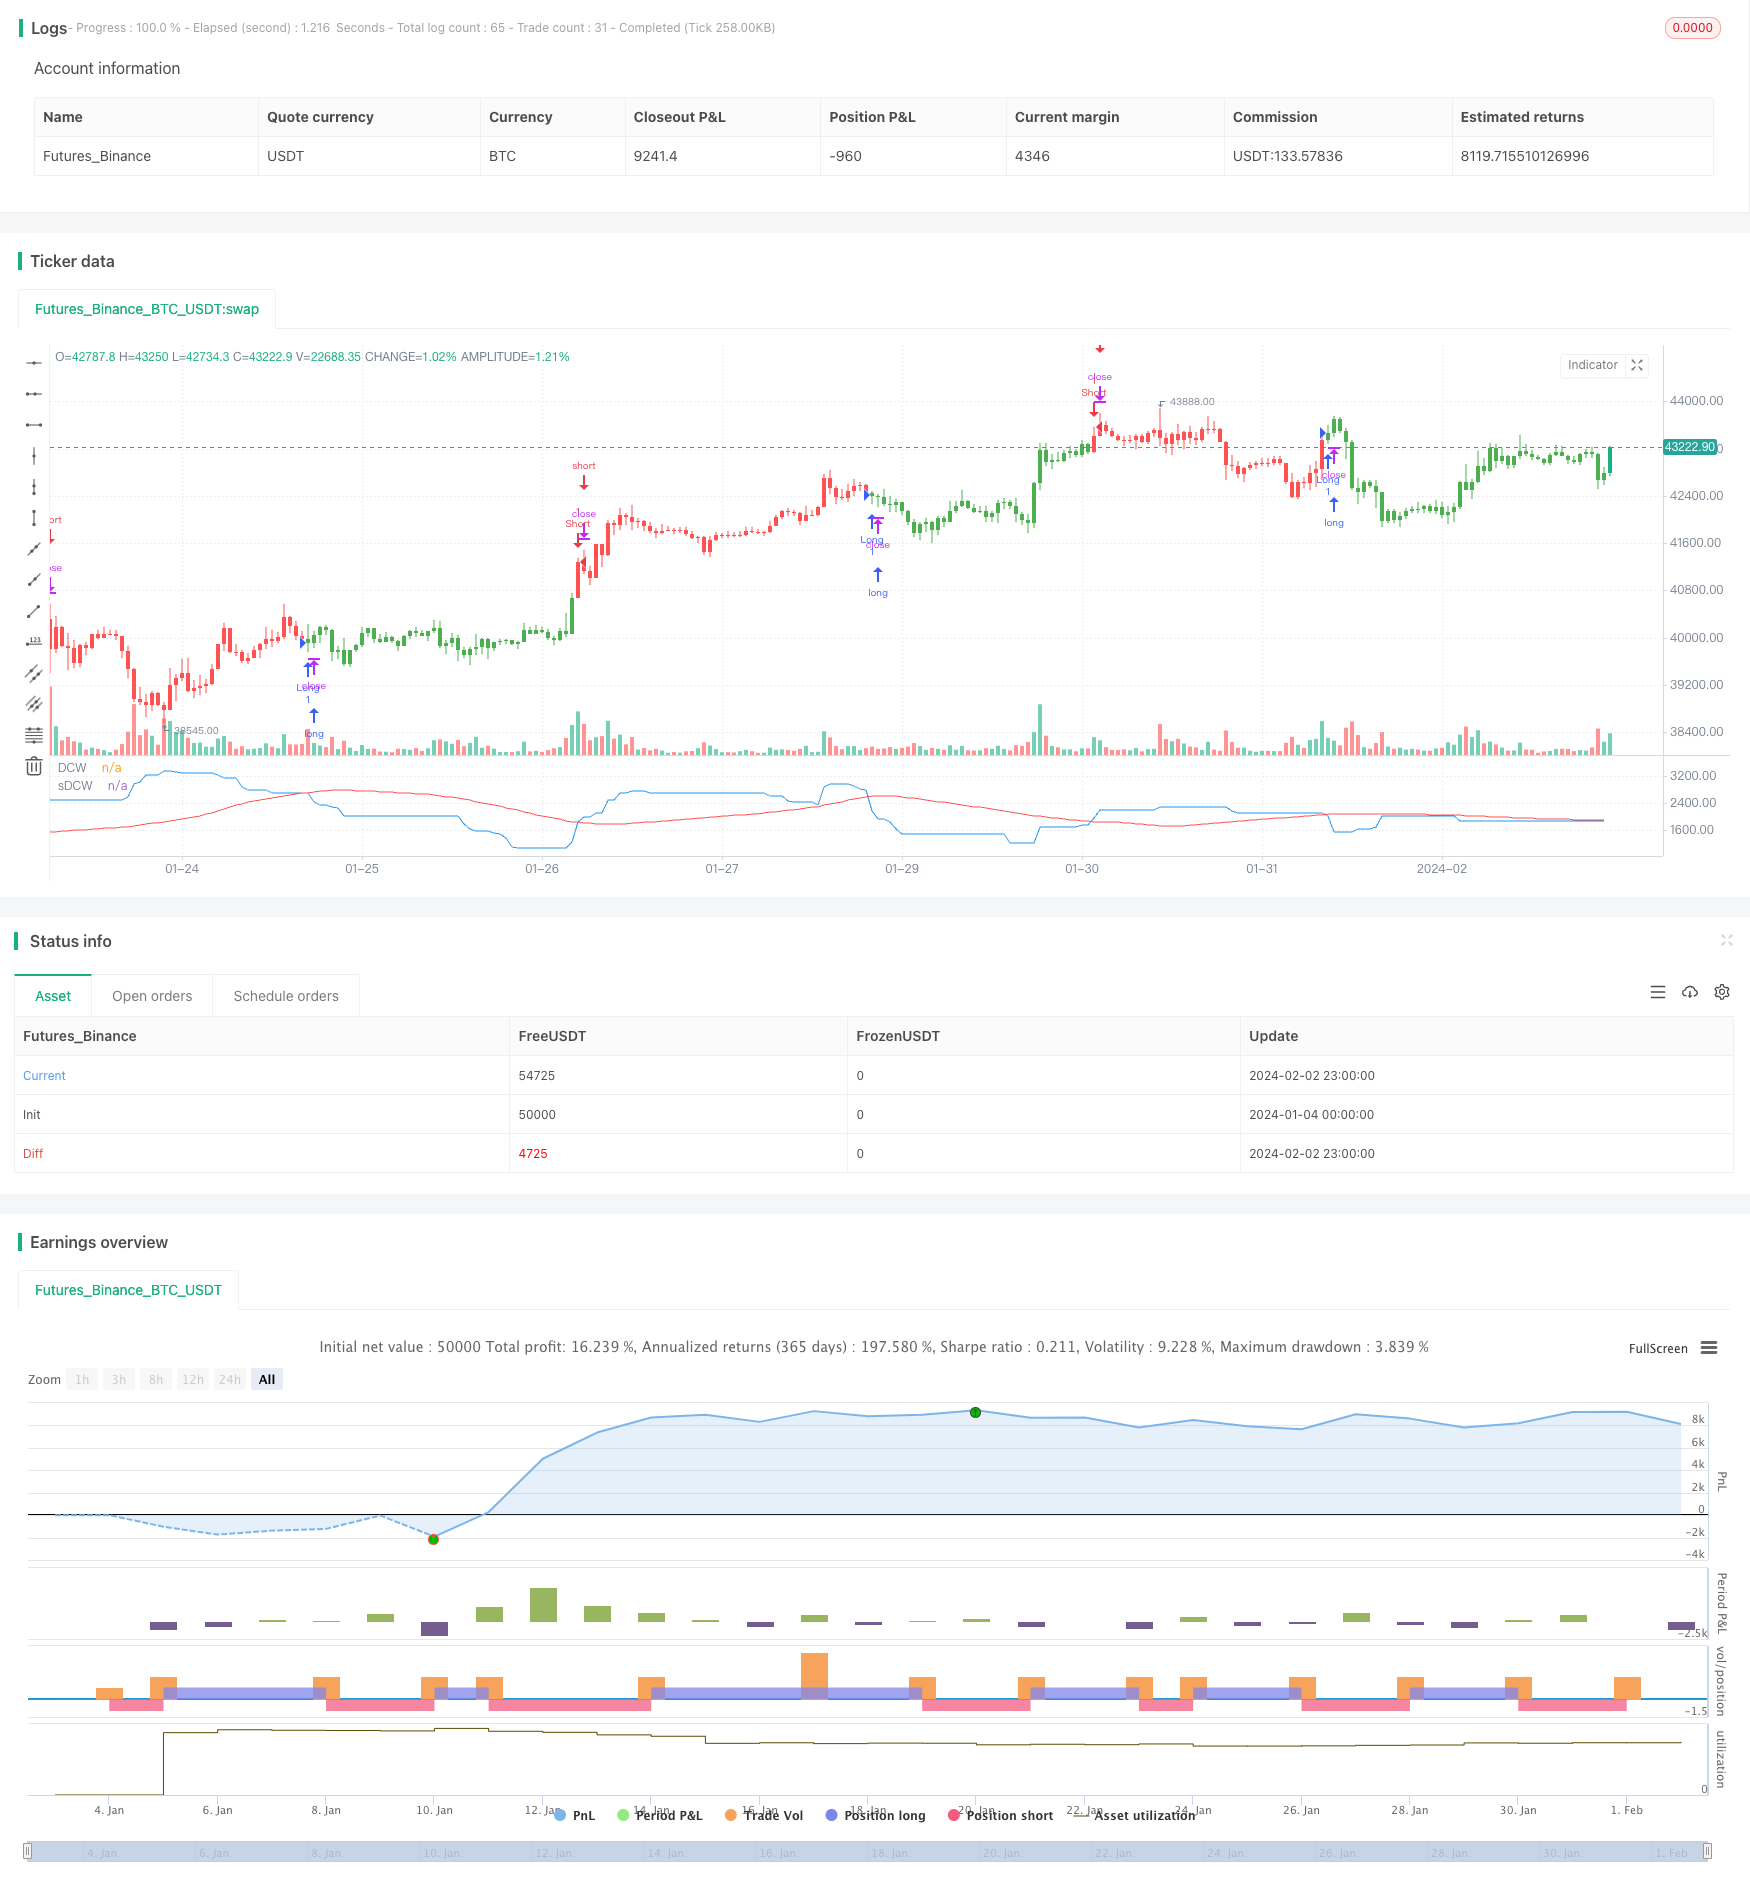
唐通道幅の取引戦略は,唐通道指標に基づいて開発された量的な取引戦略である.この戦略は,一定の周期における最高価格と最低価格の差値,すなわち唐通道幅を計算することによって,市場の変動の程度とリスクのレベルを判断する.唐通道幅が平滑移動平均線より大きいときは,市場の変動が増加し,高リスク状態に入ることを表示し,小さいときは,市場の変動が減少し,低リスク状態に入ることを表示する.このような判断によって,市場の傾向と操作方向を明確にすることができる.
戦略原則
この戦略の核心指標は唐通路の幅である.唐通路の幅の計算式は以下のとおりである.
唐通路の幅 = 最高価格 - 最低価格
その中で,最高価格と最低価格は,一定の周期n内での計算で得られた.この周期は,lengthパラメータによって設定されている.
唐通路幅のデータを平滑化するために,戦略に平滑移動平均指標SMAを導入した.この指標は,誤差を減らすために唐通路幅を二度計算した.
市場リスクレベルを判断する際,唐通路の幅が平らな移動平均より大きい場合は,市場が高波動,高リスク状態に入っていることを示し,小さい場合は,市場の波動が弱まり,低リスク状態に入っていることを示します.
戦略は,リスクのレベルに応じて取引の決定を下す:リスクが高いときは空売り,リスク低いときは多売り.
戦略的優位分析
この戦略の最大の利点は,市場のリスクを波動性によって判断し,それに対応した取引決定を行うことである.これは,高リスク市場の継続的な多額の取引を効果的に防止し,または低リスク市場の空白が続くときに,不要な損失を減らすことができる.
さらに,この戦略は,唐通路の幅と,その平らな移動平均を組み合わせて,信号を判断し,データ波動によって引き起こされる誤った取引を避けるために,より信頼性が高く判断する.
全体として,この戦略は,市場リスクを一定程度判断し,比較的安定した取引決定を行うことができます. これは,最大の利点です.
リスク分析
この戦略の主なリスクは,唐津通路の幅が必ずしも市場リスクを正確に反映しているとは限らないことにある.幅と平均が異なるときは,誤った信号をもたらす可能性がある.このとき,機械的に取引する場合は,大きな損失が生じます.
また,取引パラメータの設定は,戦略の利益にも大きな影響を与える.パラメータの設定が不適切であれば,損失の可能性も増加する.
最後に,激しい波動の市場条件下では,唐通路幅度指標の効果も割引され,戦略信号が遅れている.このとき,人工介入が必要で,戦略を一時停止し,無駄な損失を避ける.
最適化の方向
この戦略は以下の点で最適化できます.
唐通路幅度指標の最適化.異なる周期のパラメータをテストして,最適なパラメータの組み合わせを見つけることができる.
波動率,交代量などの指標を組み合わせて,信号の正確性を向上させることができる.
合理的な止損は,単一の損失のサイズを大幅に削減し,全体的な利益の向上を顕著にします.
パラメータの自己適応最適化 取引のパラメータをリアルタイム市場の変化に応じて調整し,市場により良く適応させる.
アルゴリズム取引の最適化 機械学習などのアルゴリズム取引技術を導入し,戦略をより賢明で先見性のあるものにします.
要約する
唐通道幅の取引戦略は,市場の波動性やリスクレベルを判断し,それに応じて取引決定を行う.この戦略の最大の優点は,リスクを効果的に制御し,高リスクの市場で追償を避けることである.この戦略は,複数の次元から最適化され,最終的に安定した利益を達成することができる.
/*backtest
start: 2024-01-04 00:00:00
end: 2024-02-03 00:00:00
period: 1h
basePeriod: 15m
exchanges: [{"eid":"Futures_Binance","currency":"BTC_USDT"}]
*/

//@version=2
////////////////////////////////////////////////////////////
//  Copyright by HPotter v1.0 12/02/2018
// The Donchian Channel was developed by Richard Donchian and it could be compared
// to the Bollinger Bands. When it comes to volatility analysis, the Donchian Channel
// Width was created in the same way as the Bollinger Bandwidth technical indicator was.
//
// As was mentioned above the Donchian Channel Width is used in technical analysis to measure
// volatility. Volatility is one of the most important parameters in technical analysis.
// A price trend is not just about a price change. It is also about volume traded during this
// price change and volatility of a this price change. When a technical analyst focuses his/her
// attention solely on price analysis by ignoring volume and volatility, he/she only sees a part
// of a complete picture only. This could lead to a situation when a trader may miss something and
// lose money. Lets take a look at a simple example how volatility may help a trader:
//
//    Most of the price based technical indicators are lagging indicators.
//    When price moves on low volatility, it takes time for a price trend to change its direction and
// it could be ok to have some lag in an indicator.
//    When price moves on high volatility, a price trend changes its direction faster and stronger.
// An indicator's lag acceptable under low volatility could be financially suicidal now - Buy/Sell signals could be generated when it is already too late.
//
// Another use of volatility - very popular one - it is to adapt a stop loss strategy to it:
//    Smaller stop-loss recommended in low volatility periods. If it is not done, a stop-loss could
// be generated when it is too late.
//    Bigger stop-loss recommended in high volatility periods. If it is not done, a stop-loss could
// be triggered too often and you may miss good trades.
//
//You can change long to short in the Input Settings
//WARNING:
//- For purpose educate only
//- This script to change bars colors.
////////////////////////////////////////////////////////////
strategy(title="Donchian Channel Width Strategy")
length = input(50, minval=1)
smoothe = input(50, minval=1)
reverse = input(false, title="Trade reverse")
xUpper = highest(high, length)
xLower = lowest(low, length)
xDonchianWidth = xUpper - xLower
xSmoothed = sma(xDonchianWidth, smoothe)
pos = iff(xDonchianWidth > xSmoothed, -1,
       iff(xDonchianWidth < xSmoothed, 1, nz(pos[1], 0)))
possig = iff(reverse and pos == 1, -1,
          iff(reverse and pos == -1, 1, pos))
if (possig == 1)
    strategy.entry("Long", strategy.long)
if (possig == -1)
    strategy.entry("Short", strategy.short)
barcolor(possig == -1 ? red: possig == 1 ? green : blue )
plot(xDonchianWidth, color=blue, title="DCW")
plot(xSmoothed, color=red, title="sDCW")