3つのインデックス移動平均ストッププロフィットおよびストップロス戦略
作成日:
2024-02-04 10:38:42
最終変更日:
2024-02-04 10:38:42
コピー:
0
クリック数:
866
1
フォロー
1750
フォロワー
概要
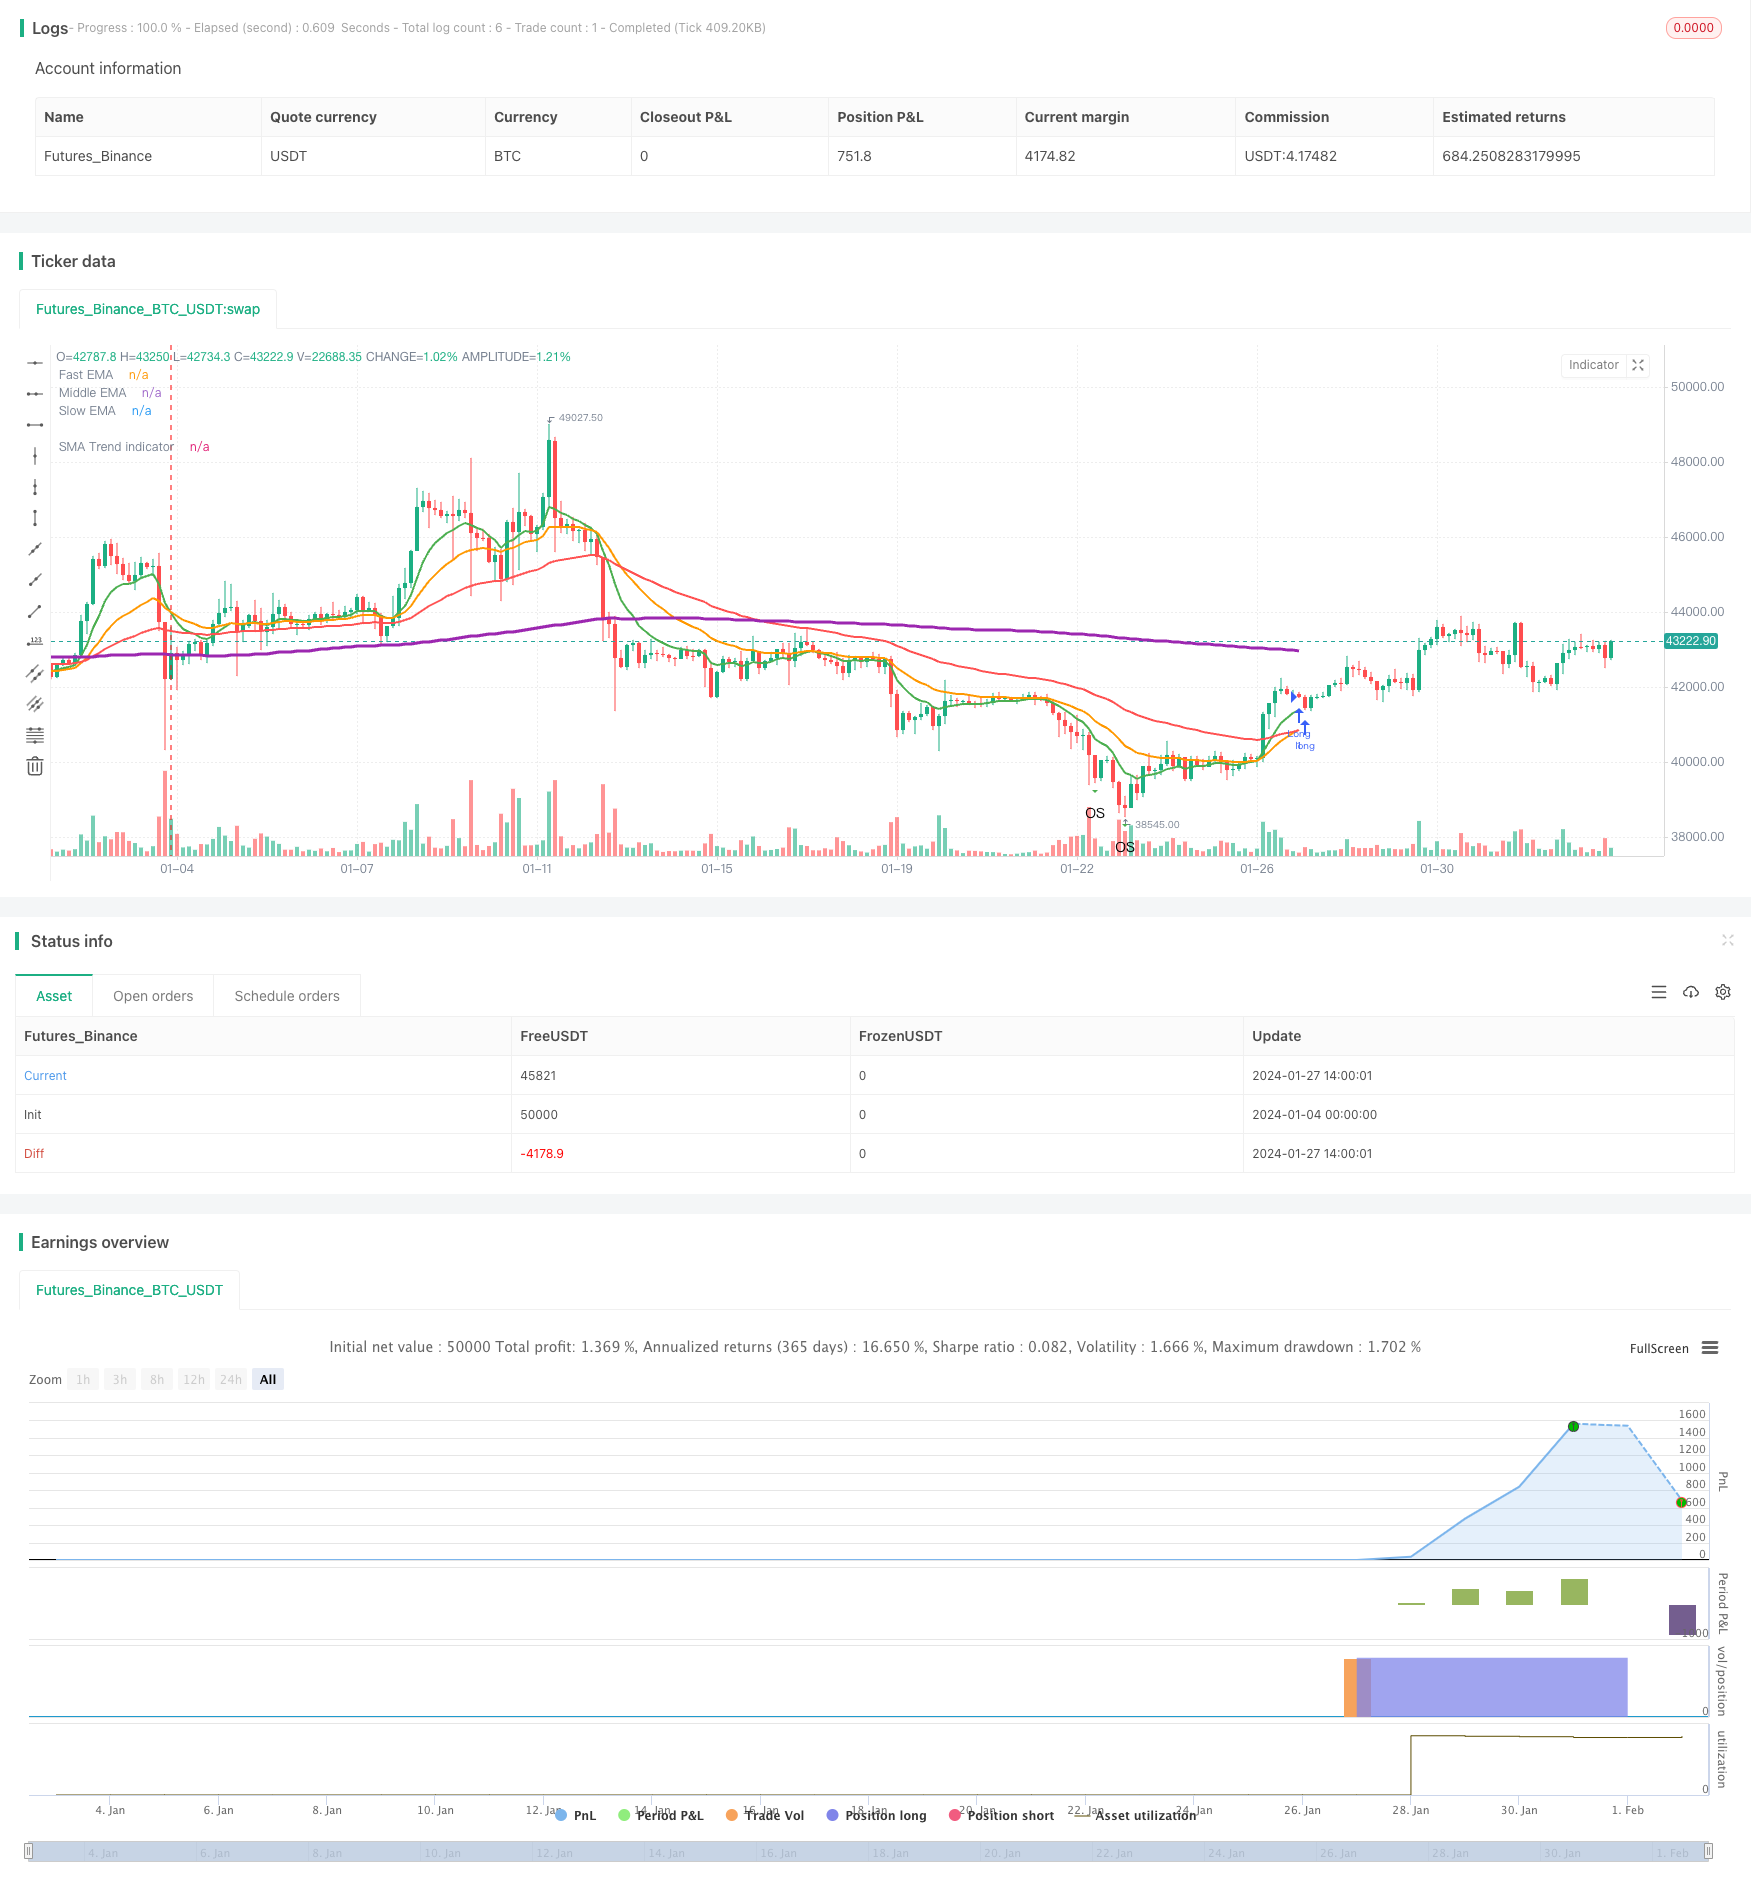
三指数均線ストップストラップストラップ戦略は,3つの異なる周期の指数移動平均に基づいて入場と出場を行うトレンド追跡戦略である.それは同時に平均真波幅指標を使用してストップストラップを設定し,リスク管理を実現する.
戦略原則
この戦略は,3つの指数移動平均を使用します.快線,中線,慢線.中線で慢線を横切るときは多行,中線の下で中線を横切るときは平行.これは典型的なトレンド追跡戦略で,3つの均線の多空変換によってトレンドの方向を判断します.
また,この戦略は,平均真波幅の指標を用いてストップ・ストップ・ストラスを計算する.具体的には,多単一ストップ・ストップは,入場価格+平均真波幅である.*ストップポイント係数; 空のストップポイントは入場価格 - 平均リアル波幅*ストップ係数. ストップダストの原理はストップと同じである. これは,一方的なリスクを効果的に制限できる.
優位分析
- 意思決定の指標は直観的に明確で分かりやすく実行されます.
- 組織的で量化が容易です
- トレンド・トラッキングとリスク・コントロールを兼ね備える
リスク分析
- 遅滞があり, タイムリーに転換を捉えることができませんでした.
- 震動の傾向で壊れやすい.
- パラメータの設定は最適化が必要で,そうでなければ効果は得られない.
リスク対応策には,平均周期を適切に短縮し,ストップ・ストップ・損失係数を最適化し,その他の意思決定指標の補助判断を追加するなどが含まれます.
最適化の方向
- 複数の平均線指標の組み合わせで,最適なパラメータを探します.
- MACD,RSIなどの他の技術指標の判断を追加します.
- 機械学習アルゴリズムによるパラメータの自動最適化.
- ストップ・ストップ・ペーストは,実際の波幅の動向に基づいて調整されます.
- 感情指数と組み合わせて,過度に混雑した取引を避けましょう.
要約する
この戦略は,全体として効果が安定したトレンド追跡戦略であり,パラメータ設定が簡単で,実行が容易である。平均実波幅のダイナミックストップストロップにより,一方的なリスクを制限できる。しかし,パラメータ最適化と指標の組み合わせに注意する必要があるので,過度な最適化と意思決定遅延を防ぐ必要がある。全体として,リスク・利益のバランスが良いので,考慮に値する。
ストラテジーソースコード
/*backtest
start: 2024-01-04 00:00:00
end: 2024-02-03 00:00:00
period: 3h
basePeriod: 15m
exchanges: [{"eid":"Futures_Binance","currency":"BTC_USDT"}]
*/

//@version=4
//© Densz
strategy("3EMA with TP & SL (ATR)", overlay=true )

// INPUTS
startTime           =       input(title="Start Time", type = input.time, defval = timestamp("01 Jan 2017 00:00 +0000"))
endTime             =       input(title="End Time", type = input.time, defval = timestamp("01 Jan 2022 00:00 +0000"))

slowEMALength       =       input(title="Slow EMA Length", type = input.integer, defval = 55)
middleEMALength     =       input(title="Middle EMA Length", type = input.integer, defval = 21)
fastEMALength       =       input(title="Fast EMA Length", type = input.integer, defval = 9)

trendMALength       =       input(title="Trend indicator MA Length", type = input.integer, defval = 200)

atrLength           =       input(title="ATR Length", type = input.integer, defval = 14)
tpATRMult           =       input(title="Take profit ATR multiplier", type = input.integer, defval = 3)
slATRMult           =       input(title="Stop loss ATR multiplier", type = input.integer, defval = 2)

rsiLength           =       input(title="RSI Length", type = input.integer, defval = 14)

// Indicators
slowEMA             =       ema(close, slowEMALength)
middEMA             =       ema(close, middleEMALength)
fastEMA             =       ema(close, fastEMALength)
atr                 =       atr(atrLength)

rsiValue            =       rsi(close, rsiLength)
isRsiOB             =       rsiValue >= 80
isRsiOS             =       rsiValue <= 20

sma200              =       sma(close, trendMALength)

inDateRange         =       true

// Plotting
plot(slowEMA, title="Slow EMA", color=color.red, linewidth=2, transp=50)
plot(middEMA, title="Middle EMA", color=color.orange, linewidth=2, transp=50)
plot(fastEMA, title="Fast EMA", color=color.green, linewidth=2, transp=50)

plot(sma200, title="SMA Trend indicator", color=color.purple, linewidth=3, transp=10)
plotshape(isRsiOB, title="Overbought", location=location.abovebar, color=color.red, transp=0, style=shape.triangledown, text="OB")
plotshape(isRsiOS, title="Oversold", location=location.belowbar, color=color.green, transp=0, style=shape.triangledown, text="OS")

float takeprofit    =       na
float stoploss      =       na

var line tpline     =       na
var line slline     =       na

if strategy.position_size != 0
    takeprofit := takeprofit[1]
    stoploss := stoploss[1]
    line.set_x2(tpline, bar_index)
    line.set_x2(slline, bar_index)
    line.set_extend(tpline, extend.none)
    line.set_extend(slline, extend.none)

// STRATEGY
goLong  = crossover(middEMA, slowEMA) and inDateRange
closeLong = crossunder(fastEMA, middEMA) and inDateRange


if goLong
    takeprofit := close + atr * tpATRMult
    stoploss := close - atr * slATRMult
    // tpline := line.new(bar_index, takeprofit, bar_index, takeprofit, color=color.green, width=2, extend=extend.right, style=line.style_dotted)
    // slline := line.new(bar_index, stoploss, bar_index, stoploss, color=color.red, width=2, extend=extend.right, style=line.style_dotted)
    // label.new(bar_index, takeprofit, "TP", style=label.style_labeldown)
    // label.new(bar_index, stoploss, "SL", style=label.style_labelup)
    strategy.entry("Long", strategy.long, when = goLong)
    strategy.exit("TP/SL", "Long", stop=stoploss, limit=takeprofit)
if closeLong
    takeprofit := na
    stoploss := na
    strategy.close(id = "Long", when = closeLong)

if (not inDateRange)
    strategy.close_all()