モメンタムオシレータークロス移動平均取引戦略
概要
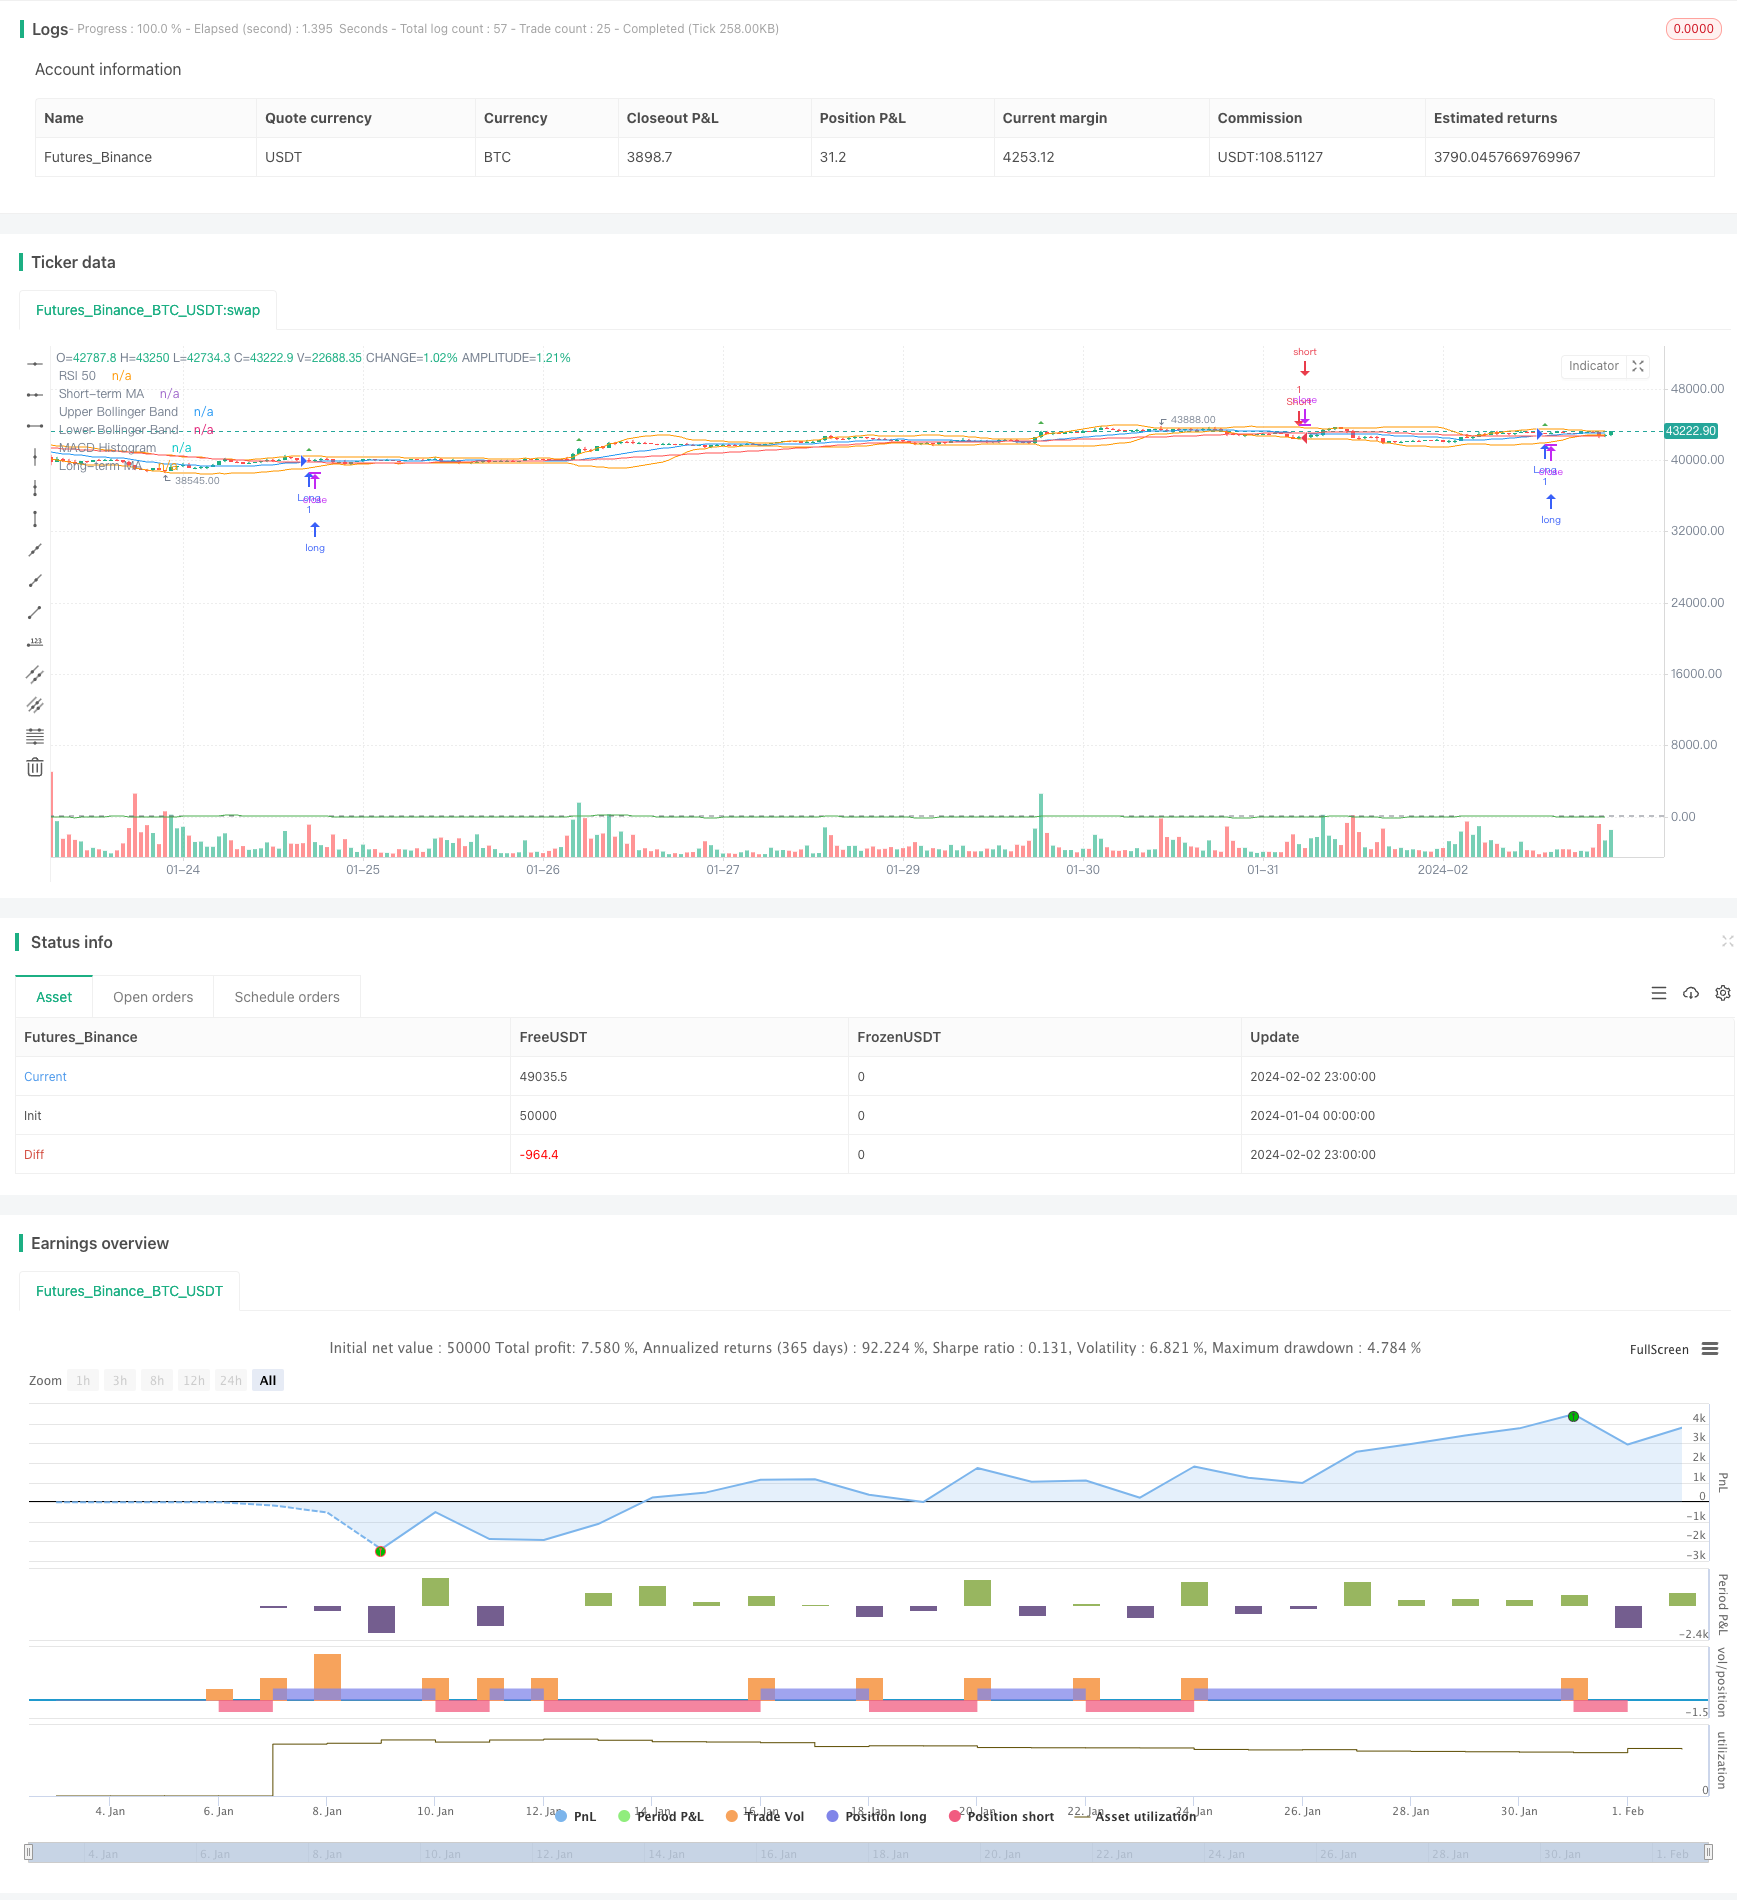
スウィングトレーディング戦略 (Swing Trading Strategy Based on Momentum, Oscillation and Moving Average Crossover) は,モメンタム指標,オシラッション指標,および移動平均線の交差を利用して買入シグナルを行う戦略である.これは,商品,外貨などの市場の日内および日間の取引に使用することができる.
戦略原則
この戦略は,移動平均,相対的に強い指標 (RSI),MACD,ブリンを併せて4つの技術指標を使用して,買入と売却のシグナルを識別します. 具体的ロジックは次のとおりです.
短期移動平均線上には長期移動平均線をつけ,RSIが50より大きいときは,多めに;短期移動平均線下には長期移動平均線をつけ,RSIが50より小さいときは,空いてください.
このような組み合わせは,均線の黄金交差と死交差を利用してトレンドを判断し,RSIにトレンドの逆転を回避するリスクを加えます.MACDの役割は,買出点を決定し,ブリン帯は,ストップ・ロスを設定します.
優位分析
この戦略の最大の利点は,指標の組み合わせが適切であり,トレンド指標と震動指標の互補性を効果的に利用できるということです.具体的には:
- 移動平均は主要トレンドの方向と 買い/売却のシグナルポイントを判断します.
- RSIはトレンドの逆転を回避するリスク
- MACDは特定のエントリーポイントを特定するのに役立ちます
- ブリン帯のストップポイント設定
この組み合わせにより,各指標の優位性を最大限に発揮し,互いを補完することが可能です.
リスク分析
この戦略の主なリスクは
- トレンド反転リスク 市場が急激に反転するときに,移動平均とRSIが適切なタイミングで信号を与えることができず,損失が増加する可能性があります.
- 市場が長期にわたって揺れ動いているとき,移動平均とRSIはしばしば買入シグナルを発し,簡単に取り込まれる.
- パラメータ設定不適切. パラメータ設定不適切であれば,フィルタリング効果が悪く,誤信号が生じやすい.
これらのリスクを制御するために,最適化パラメータ,ストップ・ストップの設定,ポジションの合理的な制御などの方法によって管理することができます.
最適化の方向
この戦略は以下の点で最適化できます.
- 異なる市場と異なる周期のパラメータの組み合わせをテストし,最適なパラメータを見つけます.
- 波動率の指標を増やすことで,地震の状況をより良く処理できます.
- 取引量指標のフィルタリング信号を増やして,偽の突破を避ける.
- ディープラーニングのアルゴリズムとリアルタイムでパラメータを最適化することで,システムをより賢くする.
- ストップ・ローズ・ストップ・ロジックを最適化して,利益の向上と損失の削減を図る.
要約する
動的振動横均線取引戦略は,トレンド指標と振動指標の優位性を互補的に認識し,買入シグナルを認識し,パラメータ最適化とリスク管理が適切な場合,良い効果を得ることができます. この戦略は,指標パラメータ,ストップ・ロジックなどの側面をさらに最適化することができ,その結果,より優れたパフォーマンスを得ることができます.
//@version=5
strategy("Swing Trading Strategy", overlay=true)

// Input for moving averages
shortMA = input(20, title="Short-term MA")
longMA = input(50, title="Long-term MA")

// Input for RSI
rsiLength = input(14, title="RSI Length")

// Input for MACD
macdShort = input(12, title="MACD Short")
macdLong = input(26, title="MACD Long")
macdSignal = input(9, title="MACD Signal")

// Input for Bollinger Bands
bbLength = input(20, title="Bollinger Bands Length")
bbMultiplier = input(2, title="Bollinger Bands Multiplier")

// Calculate moving averages
shortTermMA = ta.sma(close, shortMA)
longTermMA = ta.sma(close, longMA)

// Calculate RSI
rsiValue = ta.rsi(close, rsiLength)

// Calculate MACD
[macdLine, signalLine, _] = ta.macd(close, macdShort, macdLong, macdSignal)

// Calculate Bollinger Bands
basis = ta.sma(close, bbLength)
upperBand = basis + bbMultiplier * ta.stdev(close, bbLength)
lowerBand = basis - bbMultiplier * ta.stdev(close, bbLength)

// Plot moving averages
plot(shortTermMA, color=color.blue, title="Short-term MA")
plot(longTermMA, color=color.red, title="Long-term MA")

// Plot RSI
hline(50, "RSI 50", color=color.gray)

// Plot MACD
plot(macdLine - signalLine, color=color.green, title="MACD Histogram")

// Plot Bollinger Bands
plot(upperBand, color=color.orange, title="Upper Bollinger Band")
plot(lowerBand, color=color.orange, title="Lower Bollinger Band")

// Strategy conditions
longCondition = ta.crossover(shortTermMA, longTermMA) and rsiValue > 50
shortCondition = ta.crossunder(shortTermMA, longTermMA) and rsiValue < 50

// Execute trades
strategy.entry("Long", strategy.long, when=longCondition)
strategy.entry("Short", strategy.short, when=shortCondition)

// Plot trade signals on the chart
plotshape(series=longCondition, title="Long Signal", color=color.green, style=shape.triangleup, size=size.small)
plotshape(series=shortCondition, title="Short Signal", color=color.red, style=shape.triangledown, size=size.small)