ダイナミックRSIインジケーター取引戦略

概要
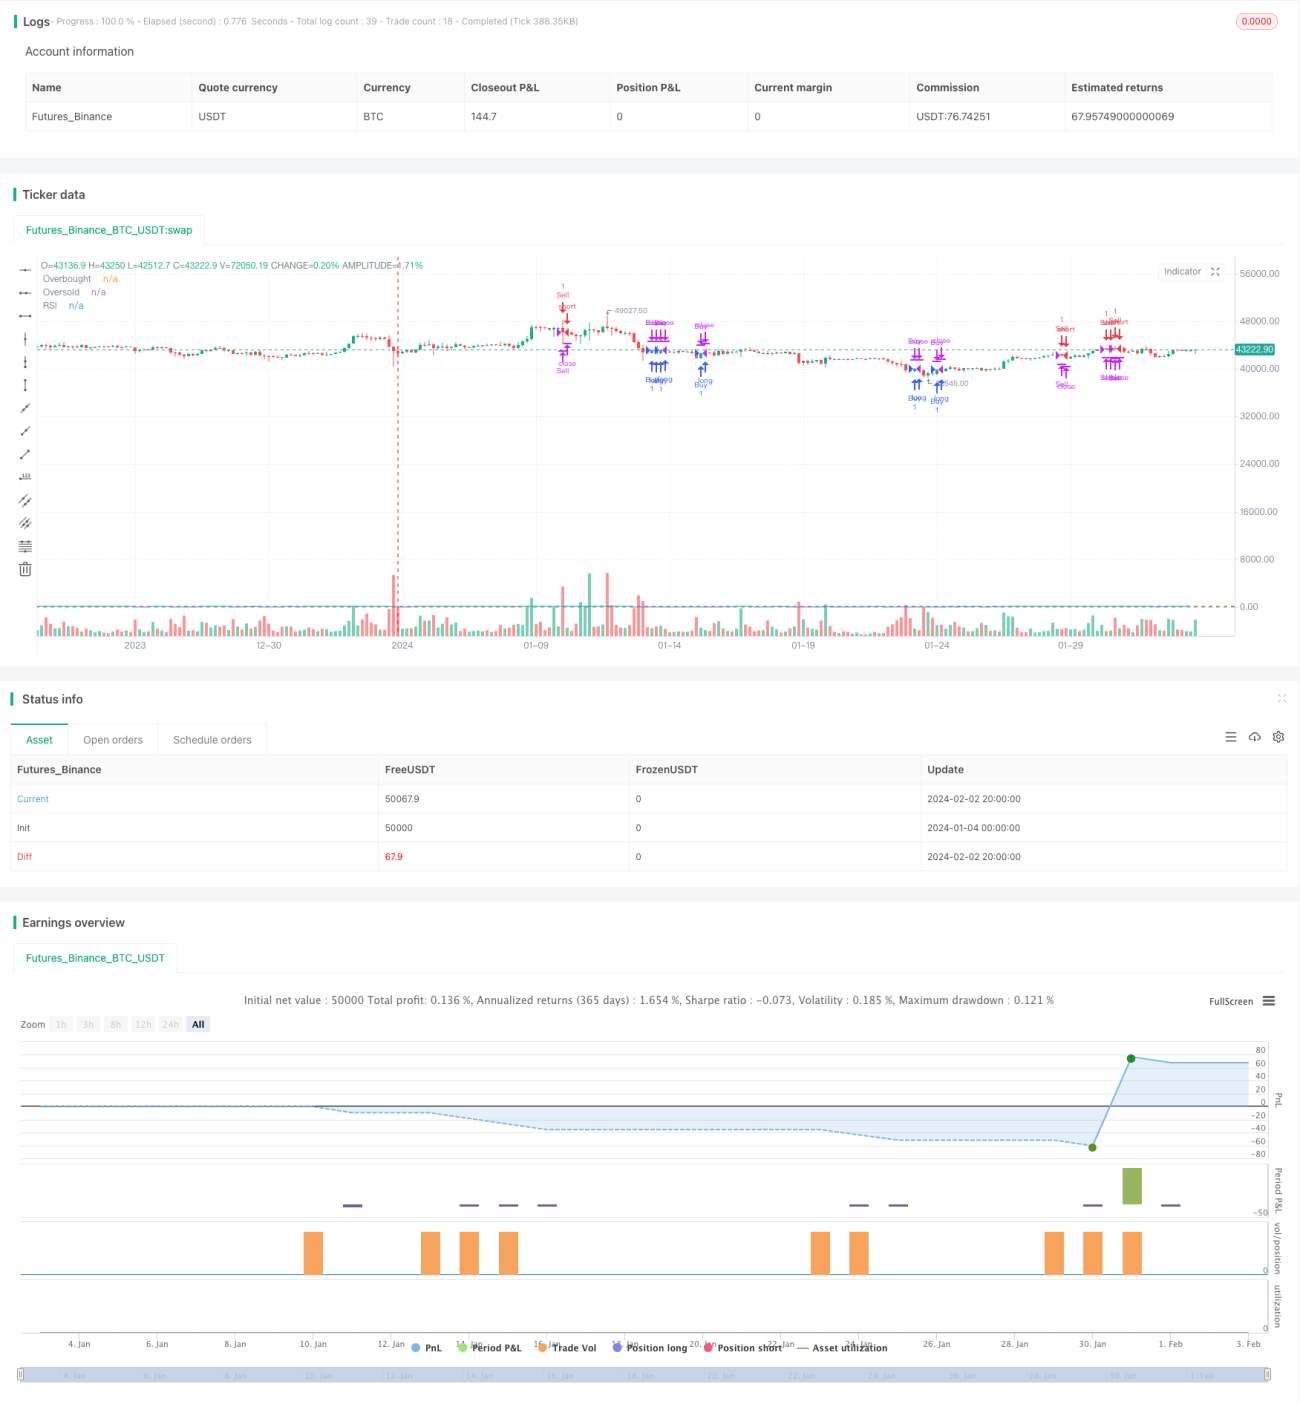
この戦略は,RSI指標を計算し,超買超売区間を設定し,ダイナミックストップと目標利益の退出を組み合わせて,取引戦略を構築する. RSI指標上の超売区間を突破するときに空白し,超売区間を突破するときに多額にする. また,ストップと目標利益を追跡してポジションを退出する.
戦略原則
この戦略は,市場の技術的形状を判断するために14日RSI指標を使用する. RSI指標は,市場が超買いまたは超売りであるかを判断するために,一段の時間内に上昇と下降の動きの割合を反映する. この戦略のRSIの長さは14である. RSIが70を超えると,市場は超買いとみなされ,空売りとなる.
また,この戦略は,ダイナミックなストップトラッキングメカニズムを使用しています. 多頭ポジションを保有する場合は,ストップトラッキング価格が閉店価格の97%であり,空頭ポジションを保有する場合は,ストップトラッキング価格が閉店価格の103%です.
最後に,この戦略は,目標利益のメカニズムも使用する. 持仓利益が20%に達すると,ポジションを退出する. これは,利益の一部をロックして,利益の回転を避けることができる.
優位分析
この戦略には以下の利点があります.
- RSIは,超買いと超売りを判断し,市場の転換点を把握する
- ダイナミック・トラッキング・ストップにより,リスクを効果的にコントロールできます.
- 目標利益のレベルを設定し,利益の一部をロックします.
- 戦略は明快でわかりやすい.パラメータは少ないので,リールディスク操作が簡単です.
- RSIの長さ,オーバーバイオーバーセールレベル,ストップ・ローズなどのパラメータを簡単に最適化できます.
リスク分析
この戦略にはいくつかのリスクがあります.
- RSIが誤信号を発し,不必要な損失を引き起こす可能性
- 破損を拡大する確率で
- 利潤目標が低すぎると,十分な利潤を保持できない場合
上記のリスクは,RSIパラメータの最適化,ストップ幅の調整,目標利益要求の適切な緩和によって解決できます.
最適化の方向
この戦略は以下の方向から最適化できます.
- RSI指標のパラメータを最適化し,超買超売判断基準を調整し,偽信号の確率を下げる
- RSIが1回で誤った信号を発生しないように,他の指標のフィルターを追加します.
- 市場状況に合わせて戦略を柔軟に調整できるように,目標利益レベルを動的に最適化
- 取引量指数と組み合わせて,低取引量で偽の突破を避ける
- 機械学習アルゴリズムを追加し,パラメータを自動的に最適化
要約する
この戦略の全体的な考え方は明確で,RSI指標を使用して超買い超売を判断し,ダイナミックストップと目標利益退出を配合する。優点は,実装を理解しやすいこと,リスクがコントロールできる場所,拡張性強である。次のステップは,信号品質の向上,ダイナミック調整パラメータなどの方向から最適化することができ,戦略をより賢明にする。
- 1