ダブル移動平均スーパートレンド定量取引戦略
概要
この戦略は,双均線とスーパートレンドの2つの指標を総合的に使用して取引信号を構築し,異なる周期のトレンド方向を判断し,効率的な利益を達成します.
戦略原則
この戦略は,MACDとSuperTrendの2つの指標を使用して,入札のタイミングを判断する.その中で,MACD双均線は短期的なトレンドの方向を判断し,Supertrendは中長期的なトレンドの方向を判断する.
快線が下から上へ緩慢線を突破すると買入信号で,中期長期のスーパートレンドが上昇傾向に同調すると,最終的な買入信号が生じ,多額の取引を行う.逆に,快線が上から下へ緩慢線を突破すると売り信号で,中期長期のスーパートレンドが下降傾向に同調すると,最終的な売り信号が生じ,空きをする.
ストップダストとストップストップは固定値に設定されています.
優位分析
この戦略の最大の利点は,市場動向を判断するために,双均線とSuperTrendを同時に使用することであり,中短期と中長期を組み合わせ,意思決定の効率を大幅に高め,偽突破を回避することです.さらに,Supertrendは,市場の変動性に応じてパラメータを調整し,より広範な市場環境に適応することができます.
リスク分析
この戦略の主なリスクは,固定したストップ・ロッド・キャップの設定により,より大きな利益の余地を見逃す可能性があることにある.また,中短期と中長期の判断が分かれると,戦略は正常に機能できない.我々は,ストップ・ロッド・ロッド・フロート・キャップの設定によって,このリスクを軽減することができる.
最適化の方向
この戦略は以下の点で最適化できます.
ストップ・ストップ・ストップの動的調整メカニズムを追加し,市場の変動とトレンドに応じてストップ・ストップを設定する.
MACDパラメータを最適化して,ターゲット品種に適した平均線パラメータを見つけます.
Supertrendのパラメータを最適化して,市場への感受性を調整する.
戦略の効果を高めるために,他の指標の判断を追加し,より多くの次元の信号を提供します.
要約する
この戦略は,双均線とスーパートレンドの2つの指標の優位性を組み合わせて,異なる周期の組み合わせで判断し,誤った信号をフィルターして,トレンド市場でより良い収益を得ることができます. 参数最適化とメカニズム調整により,この戦略の安定性と収益性をさらに高めることができます.
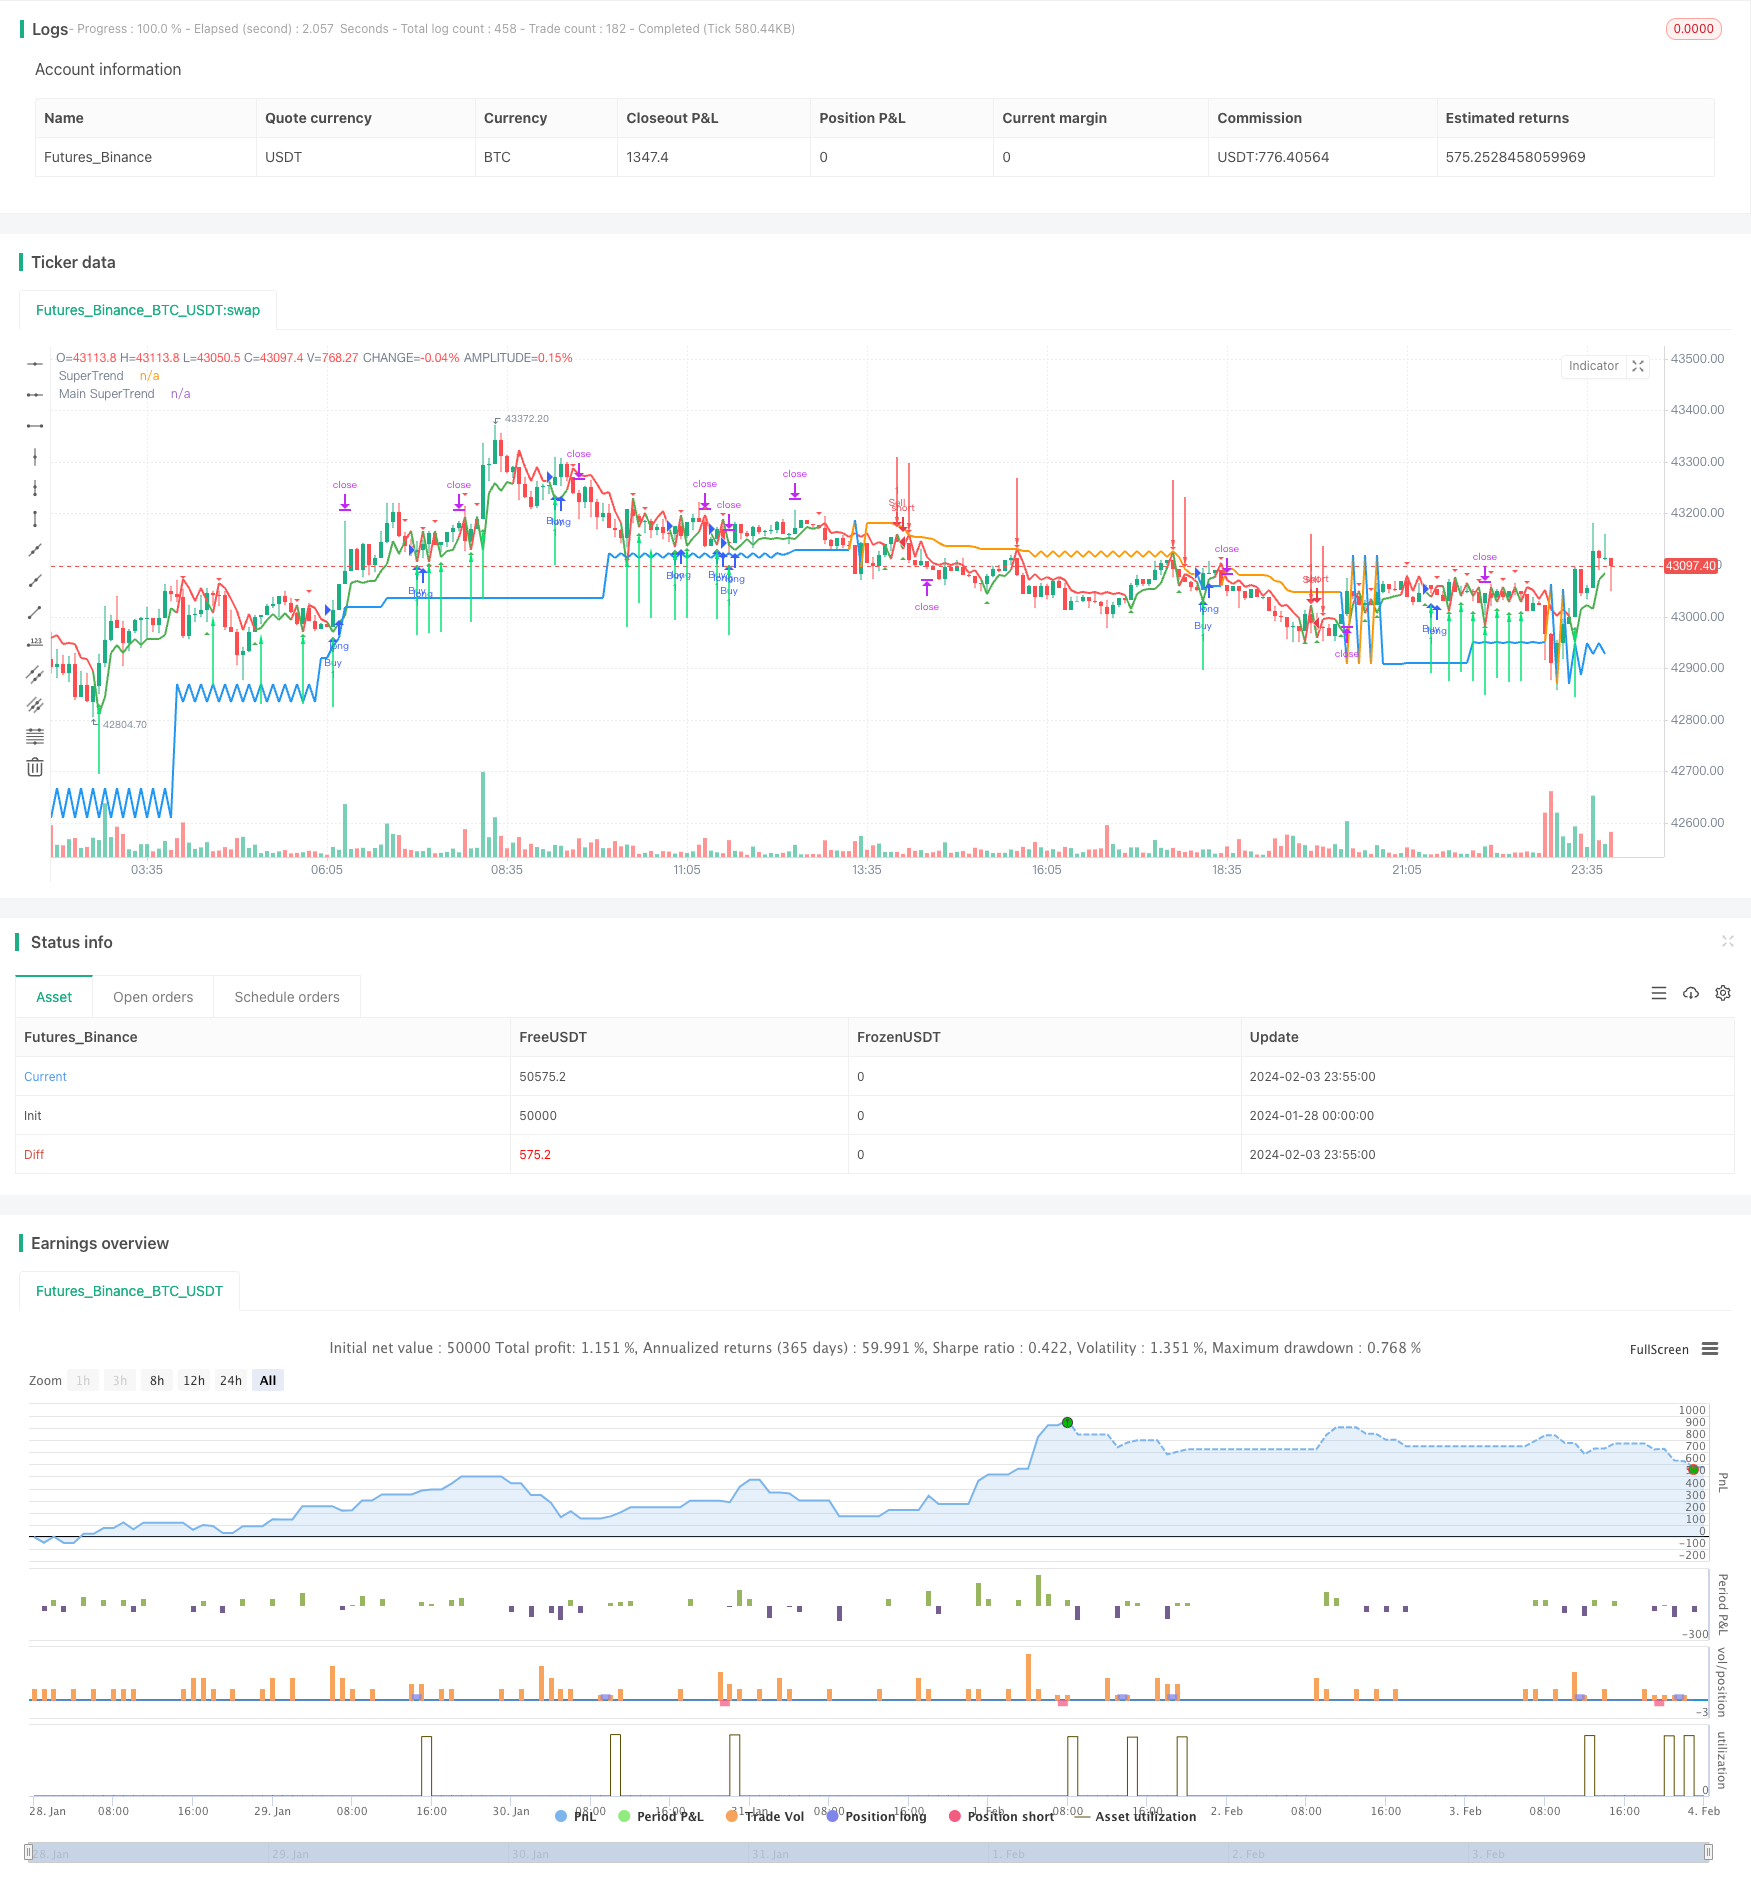
/*backtest
start: 2024-01-28 00:00:00
end: 2024-02-04 00:00:00
period: 5m
basePeriod: 1m
exchanges: [{"eid":"Futures_Binance","currency":"BTC_USDT"}]
*/

//@version=2
//Supertrend Strategy by breizh29 using *rajandran.r* Supertrend Indicator

strategy("Super Trend 2 MACD", overlay=true)
// MACD input
source = input(close)
fastLength = input(12, minval=1, title="MACD fast moving average")
slowLength=input(26,minval=1, title="MACD slow moving average")
signalLength=input(9,minval=1, title="MACD signal line moving average")

// Calculation
fastMA = sma(source, fastLength)
slowMA = sma(source, slowLength)

Macd = fastMA - slowMA
Signal = sma(Macd, signalLength)


res = input(title="Main SuperTrend Time Frame",  defval="120")
Factor=input(1, minval=1,maxval = 100)
Pd=input(1, minval=1,maxval = 100)

tp = input(500,title="Take Profit")
sl = input(400,title="Stop Loss")


Up=hl2-(Factor*atr(Pd))
Dn=hl2+(Factor*atr(Pd))
MUp=request.security(syminfo.tickerid,res,hl2-(Factor*atr(Pd)))
MDn=request.security(syminfo.tickerid,res,hl2+(Factor*atr(Pd)))

Mclose=request.security(syminfo.tickerid,res,close)

TrendUp=close[1]>TrendUp[1]? max(Up,TrendUp[1]) : Up
TrendDown=close[1]<TrendDown[1]? min(Dn,TrendDown[1]) : Dn

MTrendUp=Mclose[1]>MTrendUp[1]? max(MUp,MTrendUp[1]) : MUp
MTrendDown=Mclose[1]<MTrendDown[1]? min(MDn,MTrendDown[1]) : MDn

Trend = close > TrendDown[1] ? 1: close< TrendUp[1]? -1: nz(Trend[1],1)
Tsl = Trend==1? TrendUp: TrendDown

MTrend = Mclose > MTrendDown[1] ? 1: Mclose< MTrendUp[1]? -1: nz(MTrend[1],1)
MTsl = MTrend==1? MTrendUp: MTrendDown

linecolor = Trend == 1 ? green : red
plot(Tsl, color = linecolor , style = line , linewidth = 2,title = "SuperTrend")

Mlinecolor = MTrend == 1 ? blue : orange
plot(MTsl, color = Mlinecolor , style = line , linewidth = 2,title = "Main SuperTrend")

plotshape(cross(close,Tsl) and close>Tsl , "Up Arrow", shape.triangleup,location.belowbar,green,0,0)
plotshape(cross(Tsl,close) and close<Tsl , "Down Arrow", shape.triangledown , location.abovebar, red,0,0)

up = Trend == 1 and Trend[1] == -1 and MTrend == 1
down = Trend == -1 and Trend[1] == 1 and MTrend == -1
plotarrow(up ? Trend : na, title="Up Entry Arrow", colorup=lime, maxheight=60, minheight=50, transp=0)
plotarrow(down ? Trend : na, title="Down Entry Arrow", colordown=red, maxheight=60, minheight=50, transp=0)


golong = Trend == 1 and Trend[1] == -1 and MTrend == 1 and Macd > Signal
goshort = Trend == -1 and Trend[1] == 1 and MTrend == -1 and Macd < Signal

strategy.entry("Buy", strategy.long,when=golong)
strategy.exit("Close Buy","Buy",profit=tp,loss=sl)


strategy.entry("Sell", strategy.short,when=goshort)
strategy.exit("Close Sell","Sell",profit=tp,loss=sl)