将来の価格延長ラインバックテスト戦略
作成日:
2024-02-05 14:00:01
最終変更日:
2024-02-05 14:00:01
コピー:
3
クリック数:
858
1
フォロー
1751
フォロワー
概要
この戦略の主な考え方は,将来の価格の方向を判断するために,将来の価格の延長線を描画し,現在の価格とこの線との関係を組み合わせることである.価格が延長線より高くまたは低いとき,それに対応して多かれ少なかれすることができます.
戦略原則
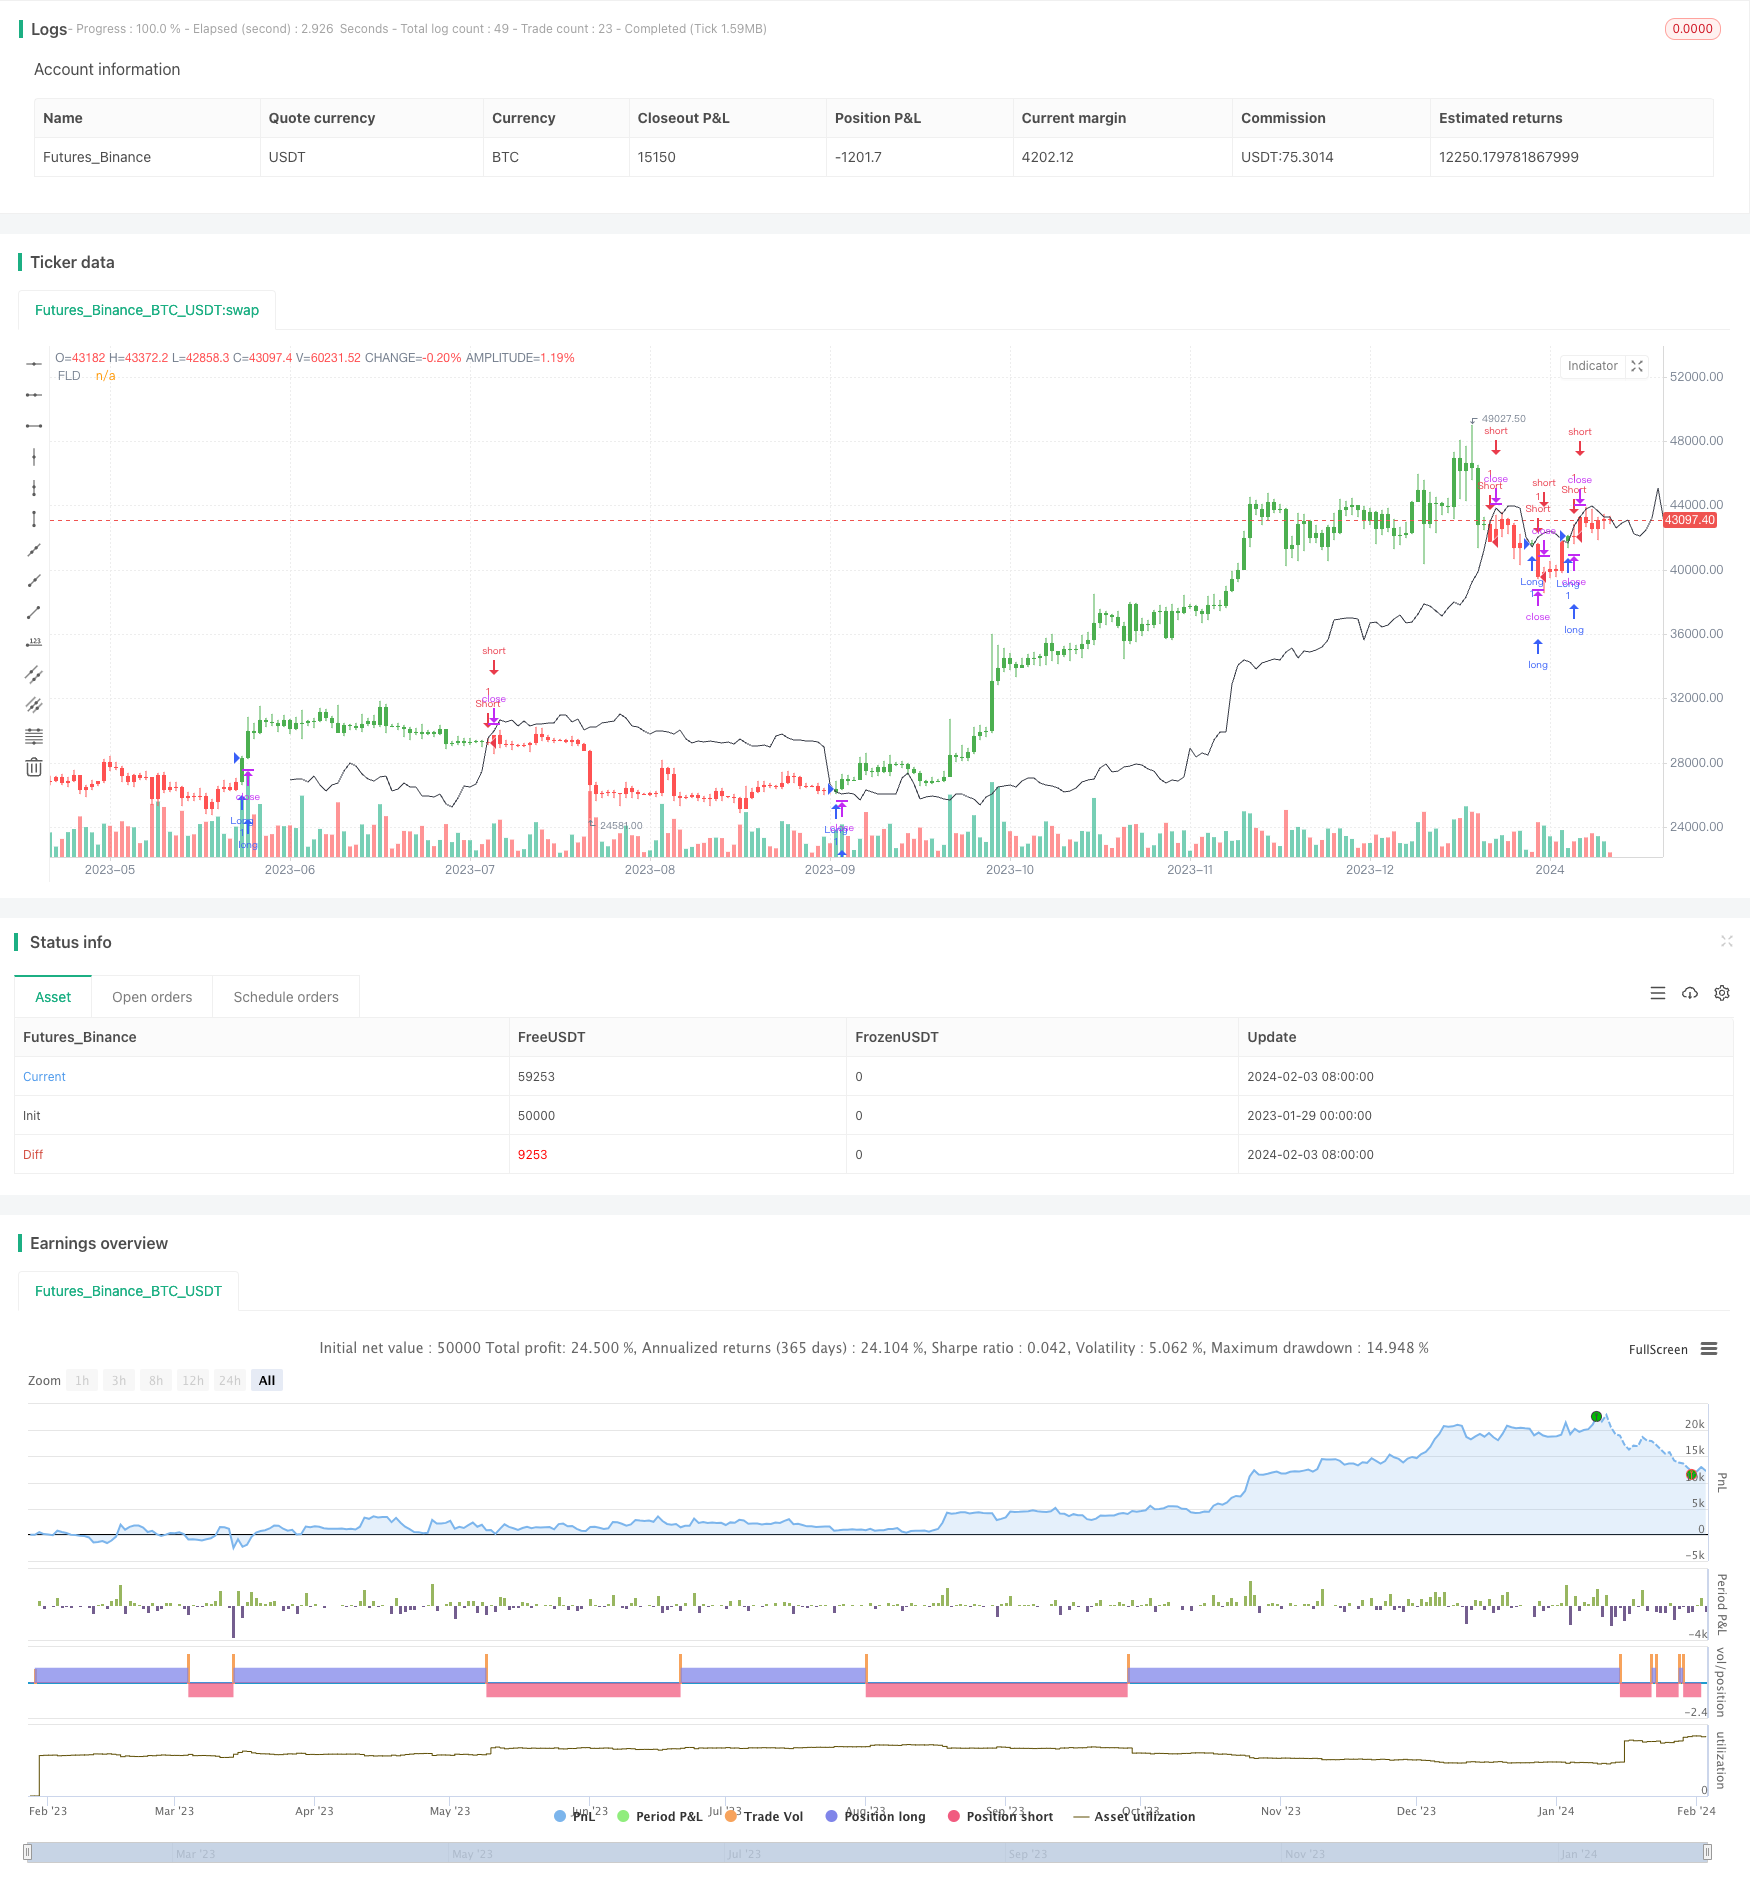
将来の価格の延長線 (Future Lines of Demarcation,FLD) は,将来の特定の周期内の中位価格,最高価格,または最低価格を代表する.この戦略は,FLDを使用して価格の将来の動きを判断する.その原理は次のとおりである.
- 周期の長さに基づいてFLDの位移周期Period,すなわちPriceの将来の価格を計算する.
- 現在のClose価格とFLD移転周期後の価格を比較する.
- CLOSE価格がFLDの未来価格より低いときは,看板信号として判断する.
- CLOSE価格がFLDの先物価格より高いときは,下落信号として判断する.
- 値と値のシグナルに応じて,相応の多空操作を行います.
優位分析
この戦略の主な利点は
- FLDは,将来の価格動向を判断する上で,高い精度を持つ.
- 異なる市場環境に適用できるカスタマイズ可能な周期パラメータ.
- 中位値,最高値,最低値をFLDのマッピングソースとして選択できます.
リスク分析
この戦略の主なリスクは
- FLD自体は失敗し,機会を逃したり,誤った信号を出すこともあります.他の指標と組み合わせて判断できます.
- 周期パラメータの設定が正しくないため,誤信号が多すぎる可能性があります. 周期長さを最適化する必要があります.
- 突発的な出来事は価格の急激な変動を引き起こし,FLDの予測は失敗する. リスクを管理するためにストップ・ロスを設定することができます.
最適化の方向
この戦略は以下の点で最適化できます.
- MACD,KDJなどの他の指標のフィルタリング信号と組み合わせて,戦略の精度を高めます.
- 周期パラメータを最適化して,最適なパラメータ組み合わせを見つけます.
- 単一損失と利益の制御のための止損防止メカニズムを増やす.
- 回測結果に応じて,空き空きを多めに調整し,誤信号を減らす.
要約する
この戦略は,価格と位移した後の将来の価格の延長線を比較して,価格の将来の動きの方向を判断し,典型的なトレンド追跡戦略の1つである.全体的に論理が明確で分かりやすい,実施リスクは低い.パラメータ最適化と指標の組み合わせにより,優れた戦略効果を得ることができる.
ストラテジーソースコード
/*backtest
start: 2023-01-29 00:00:00
end: 2024-02-04 00:00:00
period: 1d
basePeriod: 1h
exchanges: [{"eid":"Futures_Binance","currency":"BTC_USDT"}]
*/

//@version=2
////////////////////////////////////////////////////////////////////
//  Copyright by HPotter v1.0 15/02/2017
//  An FLD is a line that is plotted on the same scale as the price and is in fact the
//  price itself displaced to the right (into the future) by (approximately) half the
//  wavelength of the cycle for which the FLD is plotted. There are three FLD's that can be
//  plotted for each cycle:
//    An FLD based on the median price.
//    An FLD based on the high price.
//    An FLD based on the low price.
///////////////////////////////////////////////////////////////////
strategy(title="FLD's - Future Lines of Demarcation", overlay=true)
Period = input(title="Period", defval=40)
src = input(title="Source", defval=hl2)
reverse = input(false, title="Trade reverse")
FLD = src
pos = iff(FLD[Period] < close , 1,
       iff(FLD[Period] > close, -1, nz(pos[1], 0)))
possig = iff(reverse and pos == 1, -1,
         iff(reverse and pos == -1, 1, pos))
if (possig == 1)
    strategy.entry("Long", strategy.long)
if (possig == -1)
    strategy.entry("Short", strategy.short)
barcolor(possig == -1 ? red: possig == 1 ? green : blue)
plot(FLD, title="FLD", style=line, linewidth=1, color=black, offset = Period)