カマチラピボットとボリンジャーバンドに基づく定量戦略

1
Follow
1782
Followers
概要
この戦略は,まず,前日取引の最高価格,最低価格,および閉店価格に基づいてカマチラ軸点を計算します. そして,ブリン帯指数と組み合わせて価格をフィルターし,価格が軸点を突破したときに取引シグナルを生成します.
戦略原則
- 前日の最高値,最低値,閉店価格を計算します.
- 上線 H4,H3,H2,H1と下線 L1,L2,L3とL4を含むカマチラ軸は,公式によって計算される
- 20日 ブリンが上下する
- 価格が上昇して下落する時には多めにし,下落する時には空っぽにする
- 止損点はブリン帯の上線または下線近くにある.
優位分析
- カマチラ軸は,取引信号の信頼性を高めるために,複数のキーサポートレジスタンス点を含んでいます.
- ブリン帯の指標と組み合わせると,偽突破を効果的にフィルターできます.
- 複数のパラメータの組み合わせ,取引の柔軟性
リスク分析
- ブリン帯指数パラメータの不適切な設定は,取引シグナルエラーを引き起こす
- カマチラ枢軸の基位は,前日の取引価格に依存し,夜間空飛によって影響される可能性がある.
- 複数頭空頭操作は損失の危険性がある
最適化の方向
- ブリン帯のパラメータを最適化して,最適なパラメータの組み合わせを探します.
- 偽突破信号を他の指標と組み合わせてフィルタリング
- 単一損失を減らすために ストップ・ロスを増やす
要約する
この戦略は,カマチラ軸とブリン帯の指標を総合的に使用し,価格が重要なサポートの抵抗点を突破したときに取引信号を生成する.パラメータの最適化と信号のフィルタリングによって戦略の収益率と安定性を向上させることができる.全体的に,この戦略の取引アイデアは明確で,操作性が強く,実体検証に値する.
Source
Pine
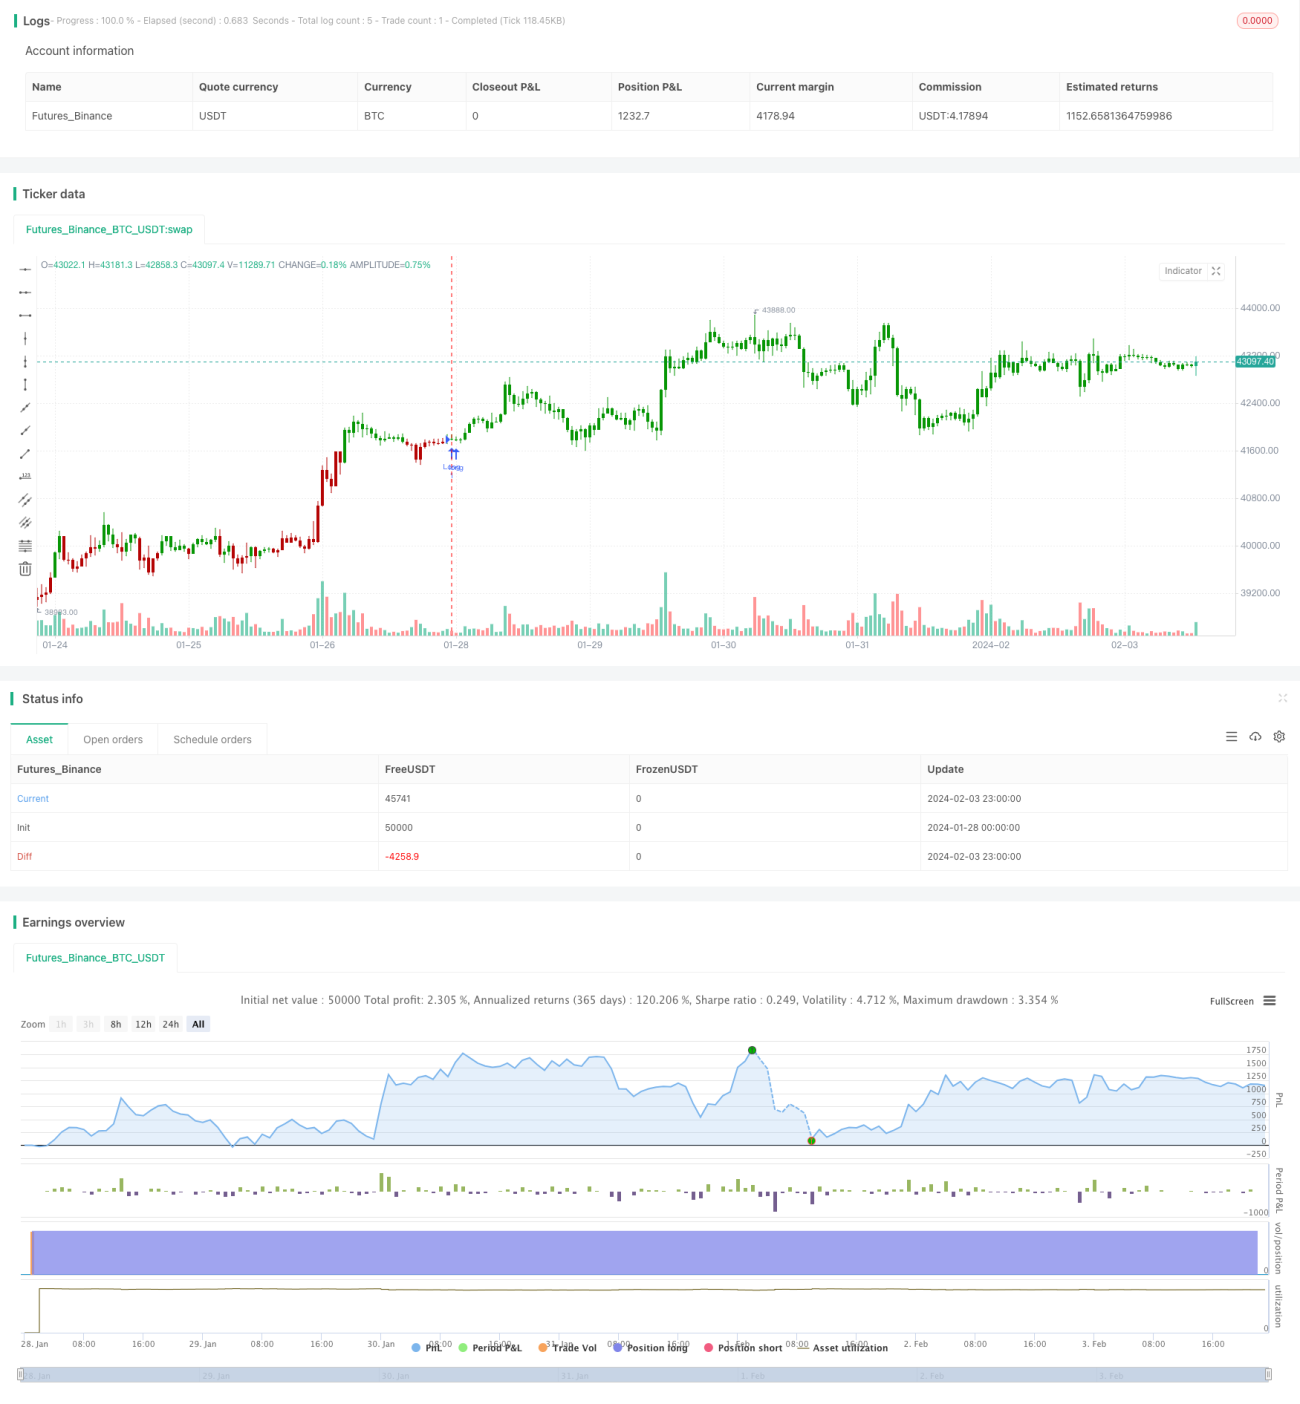
/*backtest
start: 2024-01-28 00:00:00
end: 2024-02-04 00:00:00
period: 1h
basePeriod: 15m
exchanges: [{"eid":"Futures_Binance","currency":"BTC_USDT"}]
*/

//@version=4
////////////////////////////////////////////////////////////
//  Copyright by HPotter v1.0 12/05/2020
// Camarilla pivot point formula is the refined form of existing classic pivot point formula. Strategy parameters
Related strategies
Comment
All comments (0)
No data
- 1