
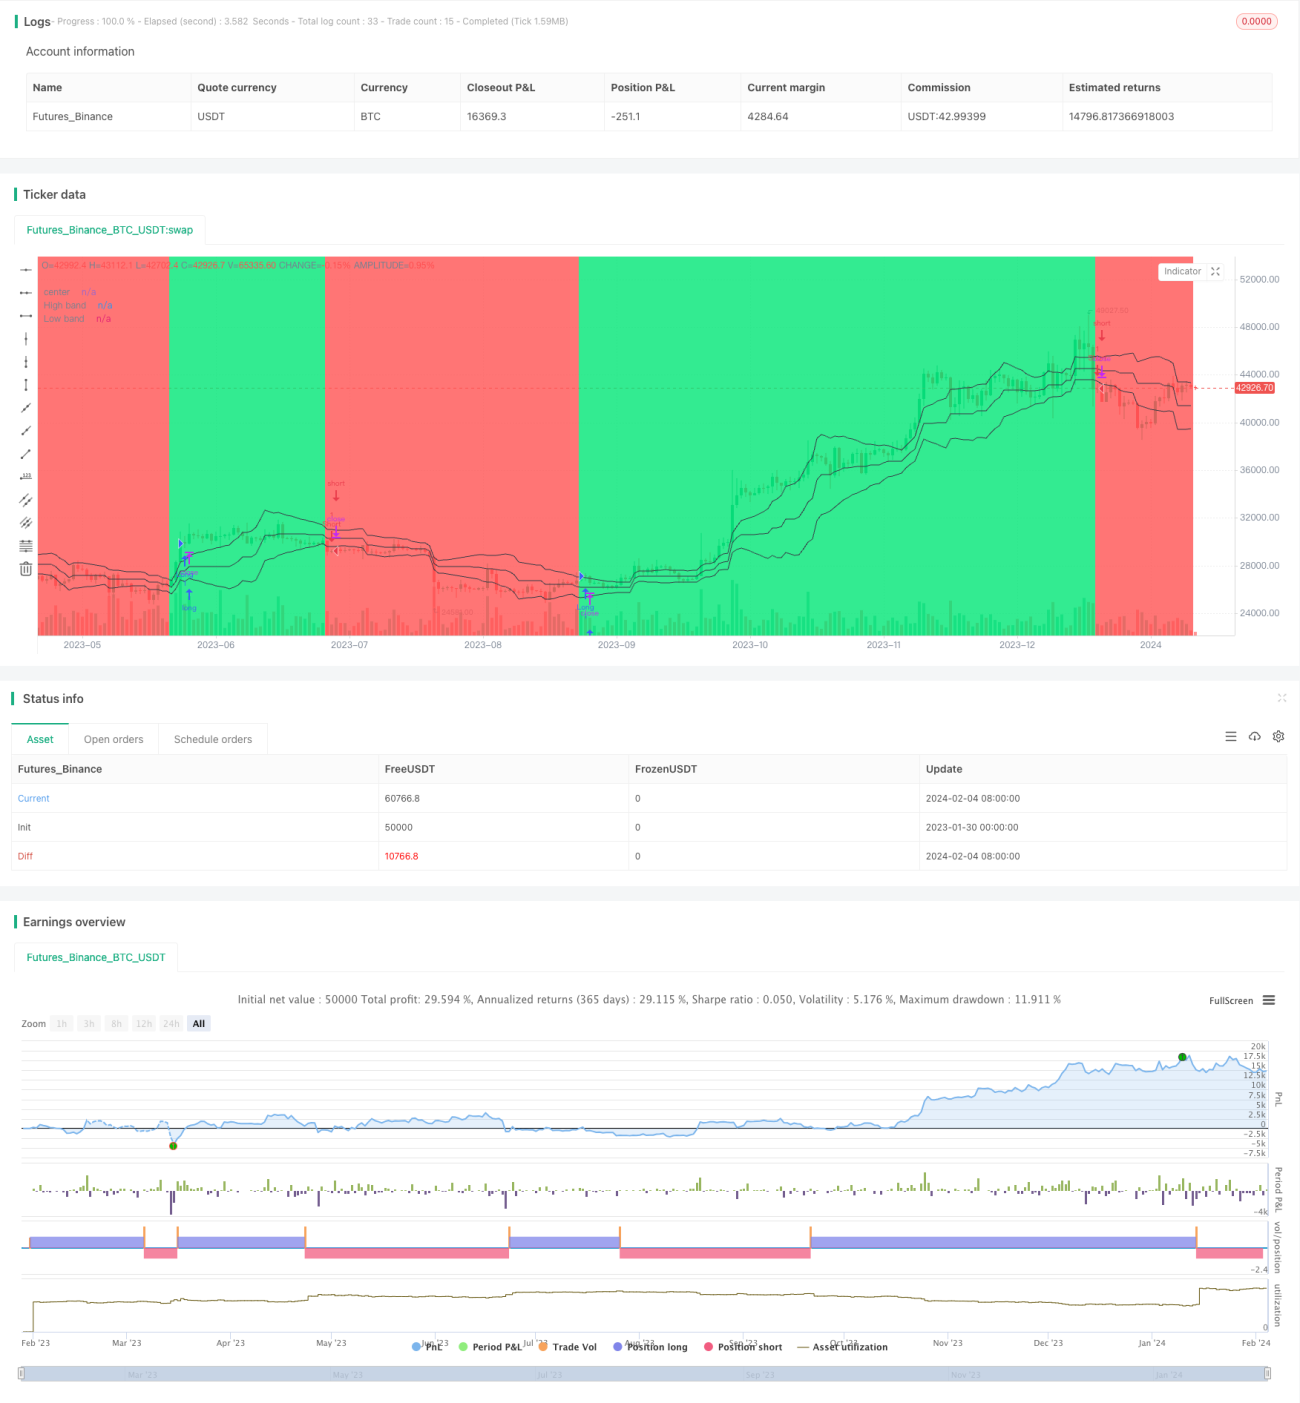
この戦略は,価格チャネルを構成し,価格が中心線から偏っている距離を計算し,均線フィルター信号と組み合わせて,トレンドの識別と追跡を実現します.価格がチャネルを突破すると取引信号を生成します.この戦略は,トレンドの追跡と突破の両方の特徴を持っています.
この戦略は,全体的により堅牢であり,中長期トレンドを効果的に追跡でき,トレンドブレイクと組み合わせて取引信号を生成します.パラメータ最適化と信号フィルタリングにより,戦略をさらに改善し,より多くの品種と市場環境に適応させることができます.
/*backtest
start: 2023-01-30 00:00:00
end: 2024-02-05 00:00:00
period: 1d
basePeriod: 1h
exchanges: [{"eid":"Futures_Binance","currency":"BTC_USDT"}]
*/
//@version=2
strategy("Noro's Bands Strategy v1.1", shorttitle = "NoroBands str 1.1", overlay=true)
//Settings
needlong = input(true, defval = true, title = "Long")
needshort = input(true, defval = true, title = "Short")
len = input(20, defval = 20, minval = 2, maxval = 200, title = "Period")
color = input(true, "Color")
needbb = input(true, defval = false, title = "Show Bands")
needbg = input(true, defval = false, title = "Show Background")
src = close
//PriceChannel 1
lasthigh = highest(src, len)
lastlow = lowest(src, len)
center = (lasthigh + lastlow) / 2
//dist
dist = abs(src - center)
distsma = sma(dist, len)
hd = center + distsma
ld = center - distsma
//Trend
trend = close < ld and high < hd ? -1 : close > hd and low > ld ? 1 : trend[1]
//Lines
colo = needbb == false ? na : black
plot(hd, color = colo, linewidth = 1, transp = 0, title = "High band")
plot(center, color = colo, linewidth = 1, transp = 0, title = "center")
plot(ld, color = colo, linewidth = 1, transp = 0, title = "Low band")
//Background
col = needbg == false ? na : trend == 1 ? lime : red
bgcolor(col, transp = 90)
//Signals
up = trend == 1 and ((close < open or color == false) or close < hd) ? 1 : 0
dn = trend == -1 and ((close > open or color == false) or close > ld) ? 1 : 0
longCondition = up == 1
if (longCondition)
strategy.entry("Long", strategy.long, needlong == false ? 0 : na)
shortCondition = dn == 1
if (shortCondition)
strategy.entry("Short", strategy.short, needshort == false ? 0 : na)