カマと移動平均に基づくトレンドフォロー戦略
作成日:
2024-02-06 09:53:22
最終変更日:
2024-02-06 09:53:22
コピー:
8
クリック数:
957
1
フォロー
1750
フォロワー
概要
この戦略の核心思想は,カマ平均線指数と平均線指数を組み合わせて市場トレンドを識別し,トレンド追跡を実現することです.カマ平均線と平均線が金色交差したとき,上昇傾向に入ると判断し,多めにしてください.カマ平均線と平均線が死亡傾向に入ると判断し,空いてください.
戦略原則
- カマ平均線 (カマ平均線) は,市場のノイズに敏感なトレンド追跡指標であり,価格の傾向を判断するために用いられる.
- 平均線を計算する。ここでは,2行平均線を計算する,一つはより速い二次指数移動平均,もう一つは通常の加重移動平均である。
- 速線が下方向からスローラインを突破するとき,多めにする.速線が上方向から下方向からスローラインを突破するとき,空いてする.このようにしてトレンド判断と追跡が完了する.
- 入場後,価格がカマ平均線を突破したときに退出し,トレンド追跡退出を実現する.
戦略的優位性
- この戦略は,カマ平均線と平均線指標を組み合わせて,市場動向を比較的に正確に判断し,トレンド追跡,逆戻り制御の能力が強くなっています.
- カマ平均線は市場の騒音に敏感で,トレンドの転換点を早期に発見できる.
- 均線組合せは判断が明確で,操作規範は分かりやすい.
- 戦略パラメータの最適化スペースは広く,異なる品種と取引品種に応じてパラメータの調整最適化を行うことができます.
リスク分析
- カマ平均線と平均線の組み合わせで市場動向を判断する際にも,誤判の可能性が生じます。判断を検証するために他の指標と組み合わせる必要があります。
- 損失のない設定は,異常な状況下では,大きな損失をもたらす可能性があります.
- パラメータ設定が不適切である場合,判断の誤りも発生し,異なる品種に応じてパラメータを調整する必要がある.
改善の提案
- ATR指数に Stop Loss 設定を加えることも検討できます.
- 異なるパラメータが戦略のリターン率に影響をテストし,最適のパラメータを選択できます.
- 判断の正確性を高めるため,震度指数などの他の指標の検証を考慮することができます.
- ポリシーのパラメータを自動的に最適化できるように,パラメータの自主適応と動的最適化のためのフレームワークを構築できます.
要約する
この戦略の全体的な考え方は明確で,カマ均線と均線指標の黄金クロスと死クロスを用いてトレンドを判断・追跡し,逆戻り制御能力は強い.パラメータ調整・最適化により,よりよい効果を得ることができる.しかし,さらに多くの検証指標と止損モジュールを追加すれば,戦略の安定性と収益力をさらに強化できる.
ストラテジーソースコード
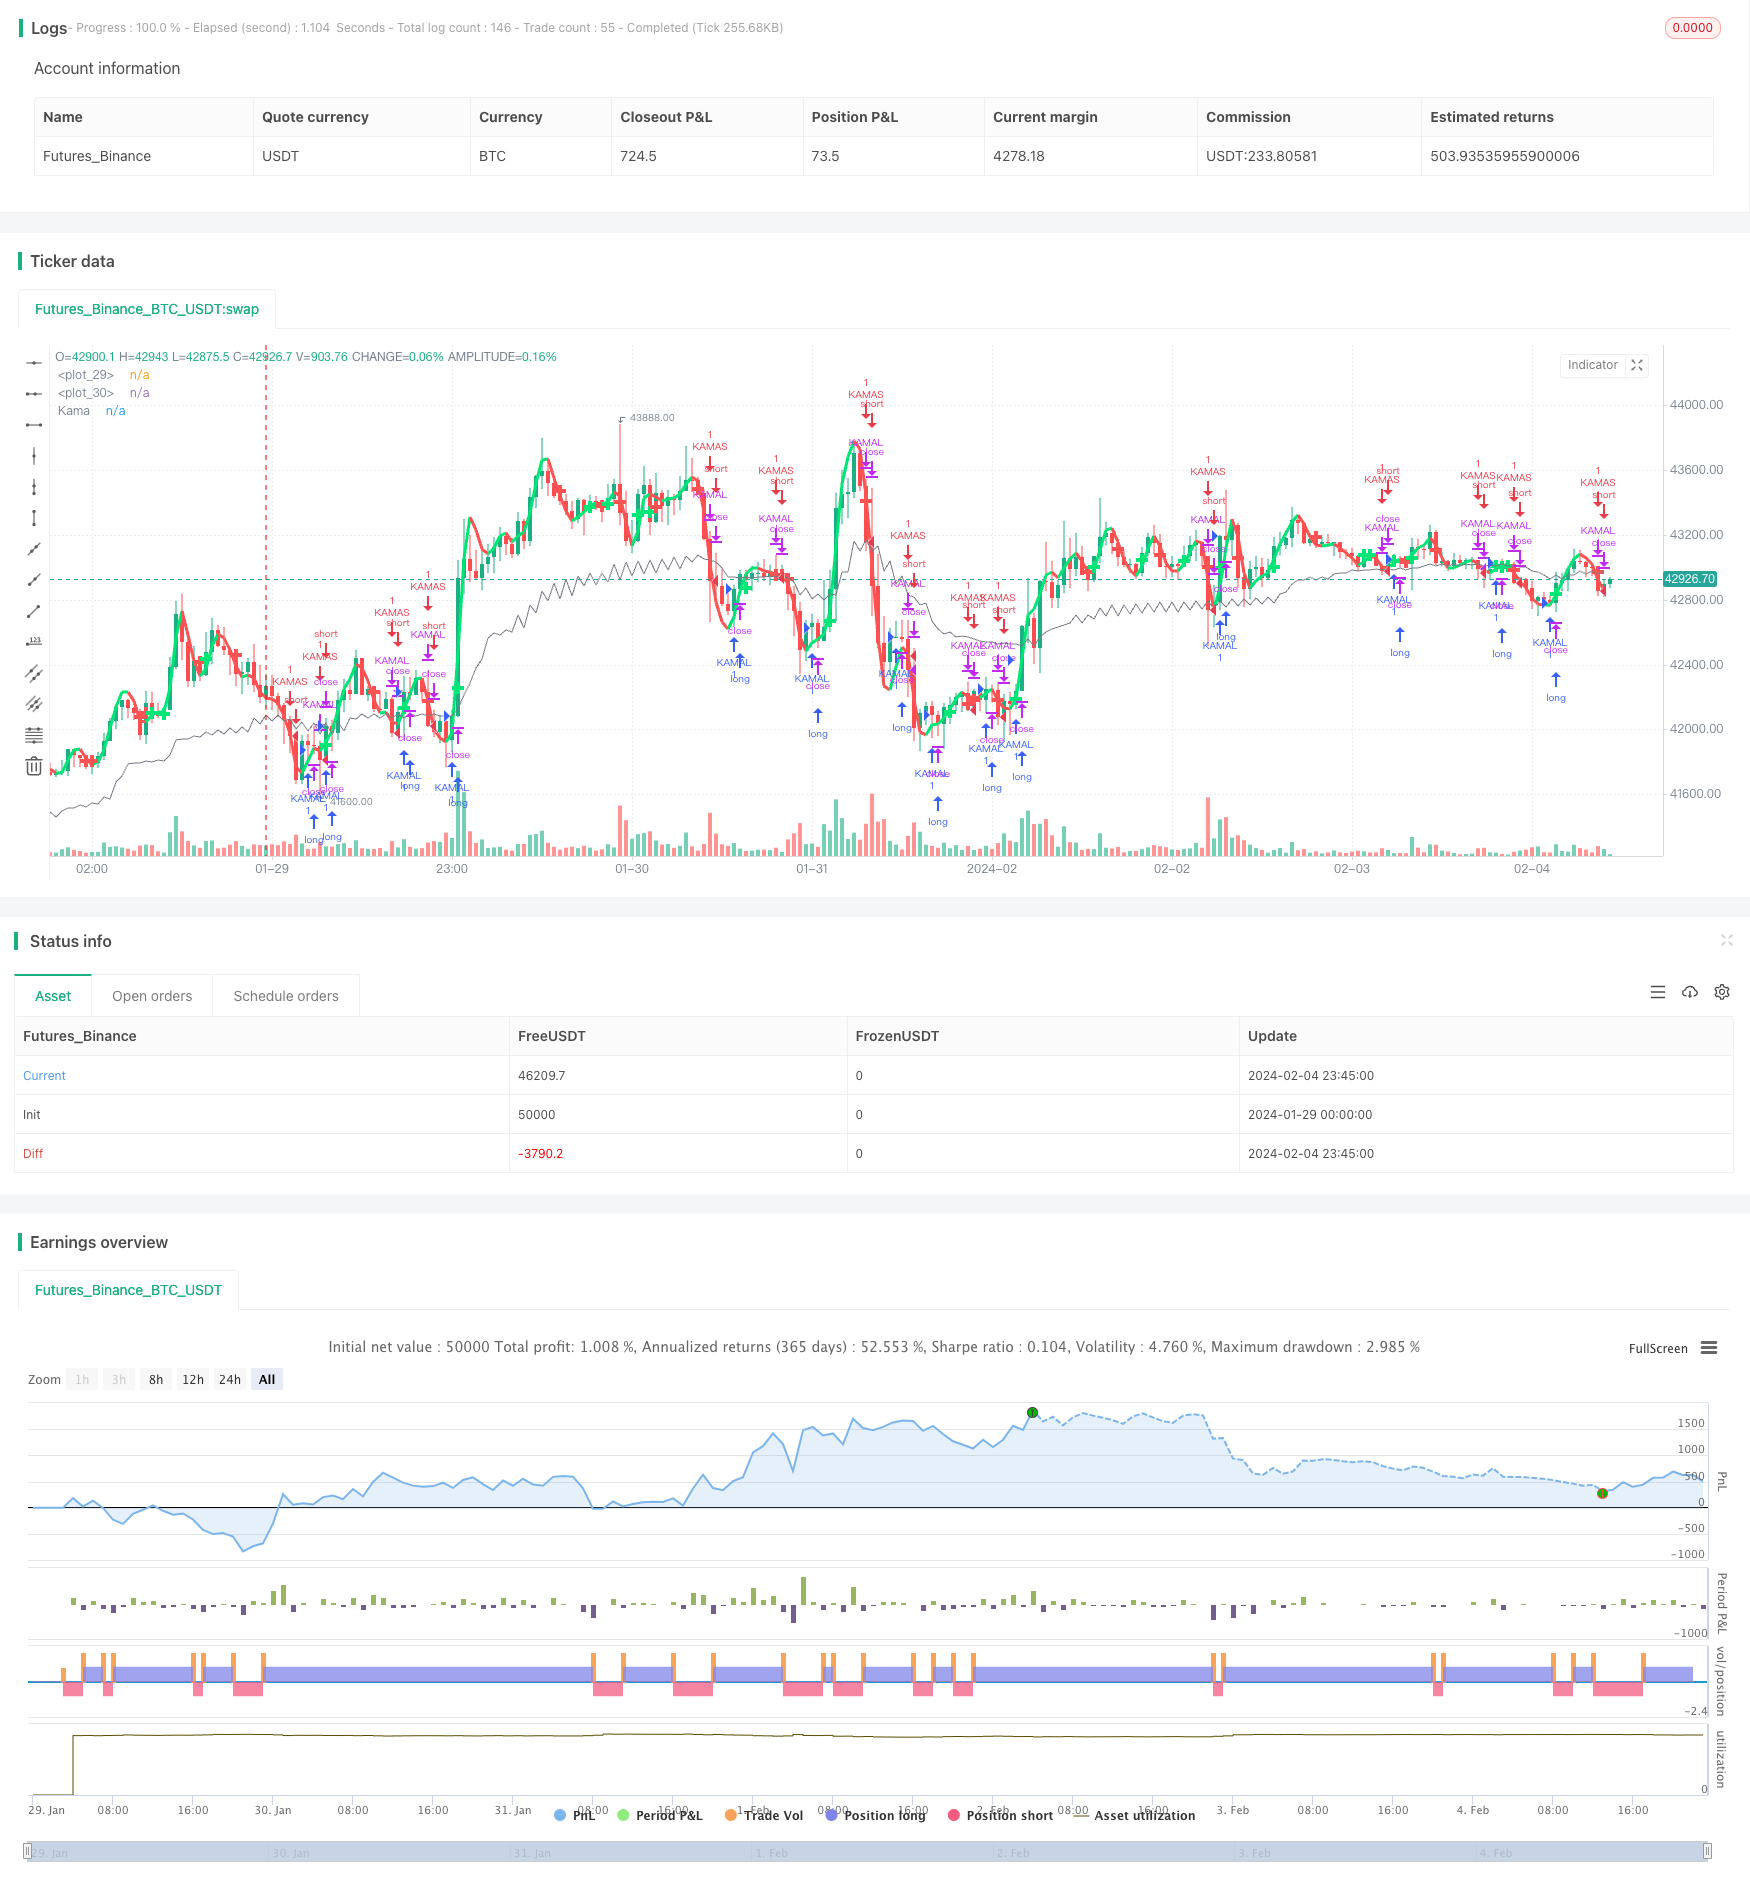
/*backtest
start: 2024-01-29 00:00:00
end: 2024-02-05 00:00:00
period: 45m
basePeriod: 5m
exchanges: [{"eid":"Futures_Binance","currency":"BTC_USDT"}]
*/

//@version=2
//synapticex.com
kamaPeriod = input(8, minval=1)
ROCLength=input(4, minval=1)

kama(length)=>
    volatility = sum(abs(close-close[1]), length)
    change = abs(close-close[length-1])
    er = iff(volatility != 0, change/volatility, 0)
    sc = pow((er*(0.666666-0.064516))+0.064516, 2)
    k = nz(k[1])+(sc*(hl2-nz(k[1])))


n=input(title="period",defval=7)

n2ma=2*wma(close,round(n/2))
nma=wma(close,n)
diff=n2ma-nma
sqn=round(sqrt(n))

n2ma1=2*wma(close[1],round(n/2))
nma1=wma(close[1],n)
diff1=n2ma1-nma1
sqn1=round(sqrt(n))

n1=wma(diff,sqn)
n2=wma(diff1,sqn)
c=n1>n2?lime:red
ma=plot(n1,color=c, linewidth = 3)
plot(cross(nma, nma1) ? nma : na, style = cross, color = c, linewidth = 5)

kamaEntry = request.security(syminfo.tickerid,timeframe.period,kama(kamaPeriod))

plot(kamaEntry, color=gray, title="Kama",transp=0, trackprice=false, style=line)


strategy("Kama VS HeikinAshi", overlay=true, pyramiding=0, calc_on_every_tick=true, calc_on_order_fills=true)

buyEntry =  n1 > n2
sellEntry = close < kamaEntry and n1 < n2

buyExit = close < kamaEntry and n1 < n2
sellExit = n1 > n2
if (buyEntry)
    strategy.entry("KAMAL", strategy.long, comment="KAMAL")
else
    strategy.close("KAMAL", when=buyExit)

if (sellEntry)
    strategy.entry("KAMAS", strategy.short, comment="KAMAS")
else
    strategy.close("KAMAS", when = sellExit)