動的移動平均と MACD クロスオーバー戦略
概要
この戦略は,MACDのゼロ軸交差と組み合わせた快線EMA ((3),慢線EMA ((11),そして再び慢線EMA ((18) の交差を計算して,入場と出場を決定する. 二重EMAとMACDの指標を使用して取引決定を行うダイナミックな戦略である.
戦略原則
この戦略は主に2つの技術分析指標に基づいています.
EMA均線交差。 快線EMA(3),慢線EMA(11) と再慢線EMA(18) の交差判断トレンド,および入場出場信号として。
MACD指数とその0軸交差。 MACDは差離値 ((DIFF) とDEAで構成。DIFFは速線EMA ((3) 減緩線EMA ((11) を構成。DEAはMACDのEMA ((27) を構成。 MACD>0は多頭表示し,MACDは空頭表示する。0軸交差は入場出場信号である。
EMA交差とMACDゼロ軸交差の組み合わせにより,3つの入場チャンスと2つの出場チャンスが設定される:
- MACDはゼロの軸上を横切って,上を横切って,初めて多チャンスを作りました.
- 速線EMA(3) 上のスローラインEMA(11) を切って2度目のチャンスに
- 快線 EMA ((3) の上で慢線 EMA ((18) を越え,第3回満仓の機会を増やす
- 快線EMA(3) 下の慢線EMA(11) を通過して,初清算の空白機会
- MACDはゼロ軸の下にあり,下向きに交差し,第2のクリアオフの空白チャンスを得る.
全体として,この戦略は双 EMA 交差系と MACD 指数を統合し,平均線パラメータと MACD パラメータを動的に調整することで,戦略の収益性を向上させることができる.
戦略的優位性
EMA均線交差とMACD指標の優位性を充分利用し,双指標判断を統合し,精度を向上させる.
3回多取引と2回清算の機会を設定し,戦略取引の頻度を増やし,利益の余地が広がる.
動態パラメータの最適化スペースは大きい.快線EMA,慢線EMA,ゼロ軸EMAおよびMACDの長さは最適化調整が可能である.
戦略の論理は明確で分かりやすく,デビューや最適化に便利です.
戦略リスク
EMAクロスとMACD指数は,誤報の一定比率を生じ,不必要な損失を引き起こす可能性があります.
取引の頻度が高く,毎回のストップ損失は小さい,損失は蓄積するリスクがある.
パラメータを最適化するのは困難で,誤った最適化は過去データに適合しない可能性があります.
取引コストの影響を十分に考慮する必要があります.
リスクについて:
合理的なストップ・ロスを設定し,単発損失を最小限に抑える.
適切なパラメータを調整し,過適合を防止する.
取引頻度を減らすことなど,コストの影響を考慮する.
戦略最適化の方向性
他の指標試験の代替:ブリン帯,KDJなど.
EMA平均線交差のパラメータを最適化:快線 EMAと遅線 EMAの長さのパラメータを変更する.
MACDの最適化パラメータ: MACDのDIFFとDEAの計算EMAの長さを変更する.
取引回数ストップ,時間ストップ,移動ストップなどのストップ戦略を増やす.
取引コストの影響を考慮し,入場数を調整します.
要約する
この戦略は,双EMA交差システムとMACD指標の組み合わせを使用して,取引頻度が高く,収益性のある潜在的なダイナミックなパラメータ戦略を構築する.同時に,戦略の論理はシンプルで明確で,理解しやすく,最適化調整する.しかし,一定の誤報リスクとパラメータ最適化の難しさもあります.これは,合理的な止損,過度適合防止などの方法によって対処する必要がある.全体的に,この戦略は,非常に強力な実用性を持っています.
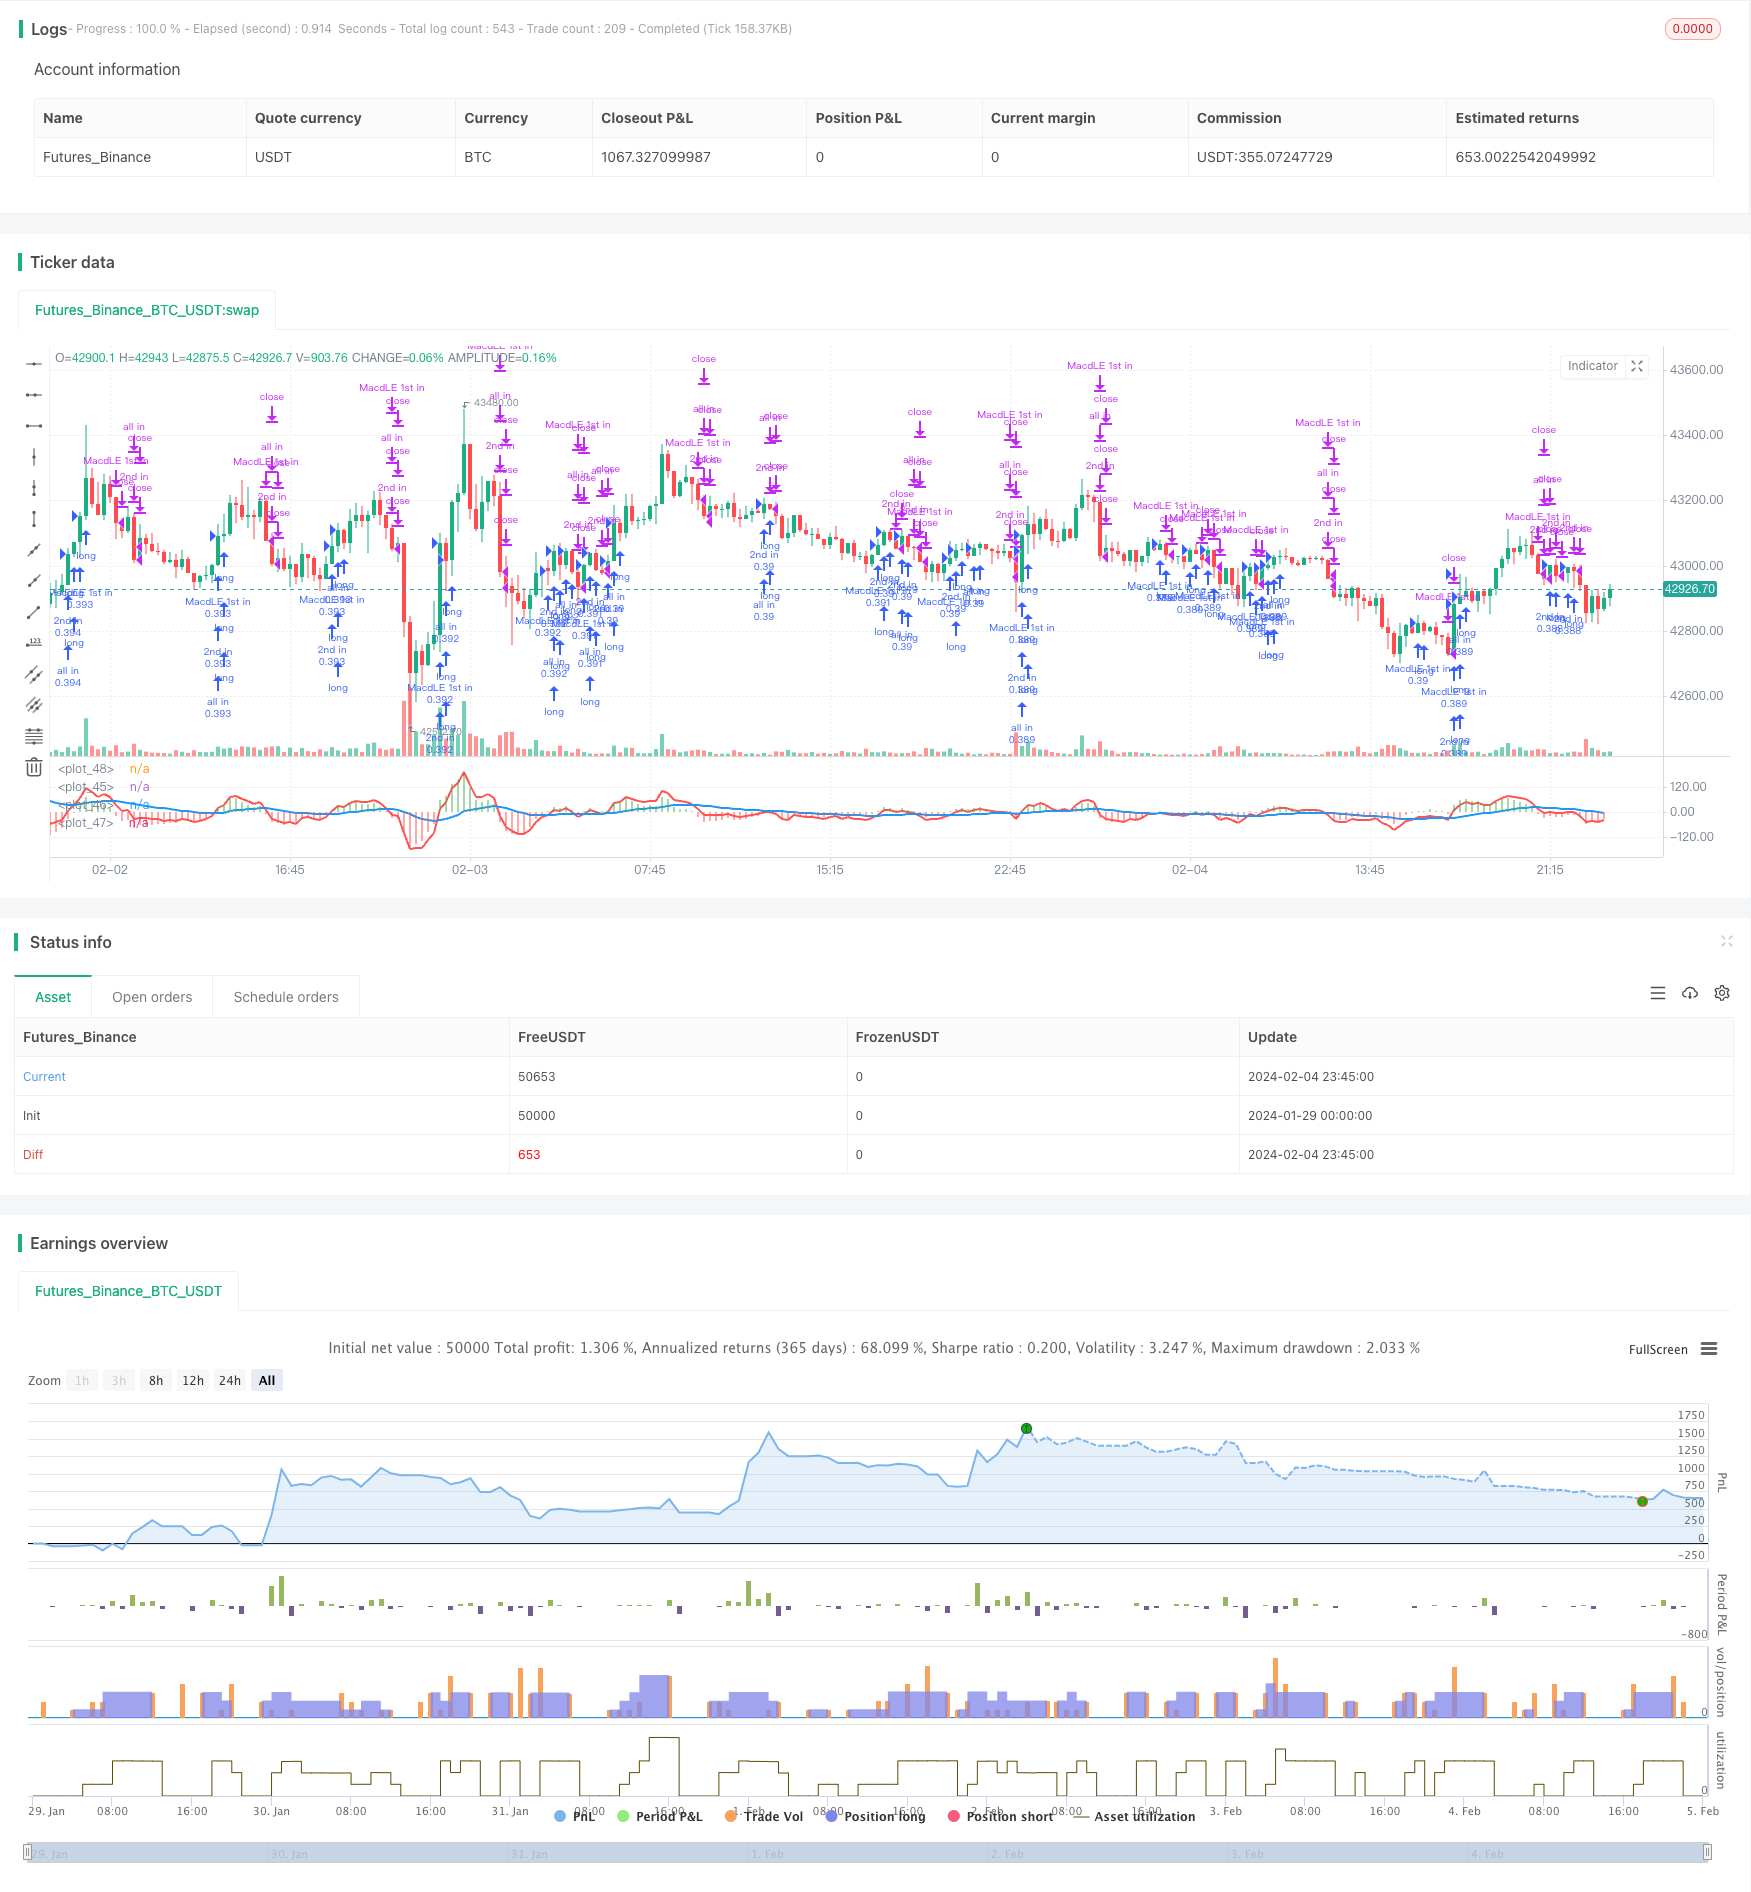
/*backtest
start: 2024-01-29 00:00:00
end: 2024-02-05 00:00:00
period: 15m
basePeriod: 5m
exchanges: [{"eid":"Futures_Binance","currency":"BTC_USDT"}]
*/

//@version=4
strategy("MACD+EMA crossovers Strategy custom",initial_capital=10000,max_bars_back=150,commission_type=strategy.commission.percent , commission_value=0.1, shorttitle="MACD+EMAcross",pyramiding = 10,default_qty_type=strategy.percent_of_equity,default_qty_value=33,overlay=false)

short = ema(close,3)
long = ema(close, 11)
long2 = ema(close, 18)
//plot(short, color = red, linewidth = 4)
//plot(long, color = blue, linewidth = 4)
//plot(long2, color = green, linewidth = 4)

isCross1 = crossover(short, long)
isCross2 = crossover(short, long2)
isCrossSell = crossunder(short, long)
//isCross3 = crossover(long, long2)

//plotshape(isCross1 and not isCross2, color=lime, style=shape.arrowup, text="1st in",size = size.tiny, location = location.belowbar)
//plotshape(isCross2 , color=lime, style=shape.arrowup, text="2nd in",size = size.tiny, location = location.belowbar)

//plotshape(isCross3 , color=lime, style=shape.arrowdown, text="All in",size = size.normal, location = location.abovebar)

//plotshape(isCrossSell , color=red, style=shape.arrowdown, text="SELL",size = size.small, location = location.abovebar)

fastLength = input(3)
slowlength = input(11)
MACDLength = input(27)

MACD = ema(close, fastLength) - ema(close, slowlength)
aMACD = ema(MACD, MACDLength) //signal
delta = MACD - aMACD // histograma

strategy.entry("MacdLE 1st in", strategy.long, comment="MacdLE 1st in",when=crossover(delta, 0))

strategy.entry("2nd in", strategy.long, comment="2nd in",when=isCross1)

strategy.entry("all in", strategy.long, comment="all in",when=isCross2)

strategy.close("2nd in",when=isCrossSell)
strategy.close("all in",when=isCrossSell)
//strategy.close("2nd in",when=crossunder(delta, 0))
//strategy.close("all in",when=crossunder(delta, 0))
strategy.close("MacdLE 1st in",when=crossunder(delta, 0))

histColour = (delta > 0) ? green : (delta < 0) ? red :  #4169E1

plot(MACD,color=red,linewidth=2)
plot(aMACD,color=blue,linewidth=2)
plot(delta,style=histogram, color=histColour, linewidth=10)
plot(0,color=white)