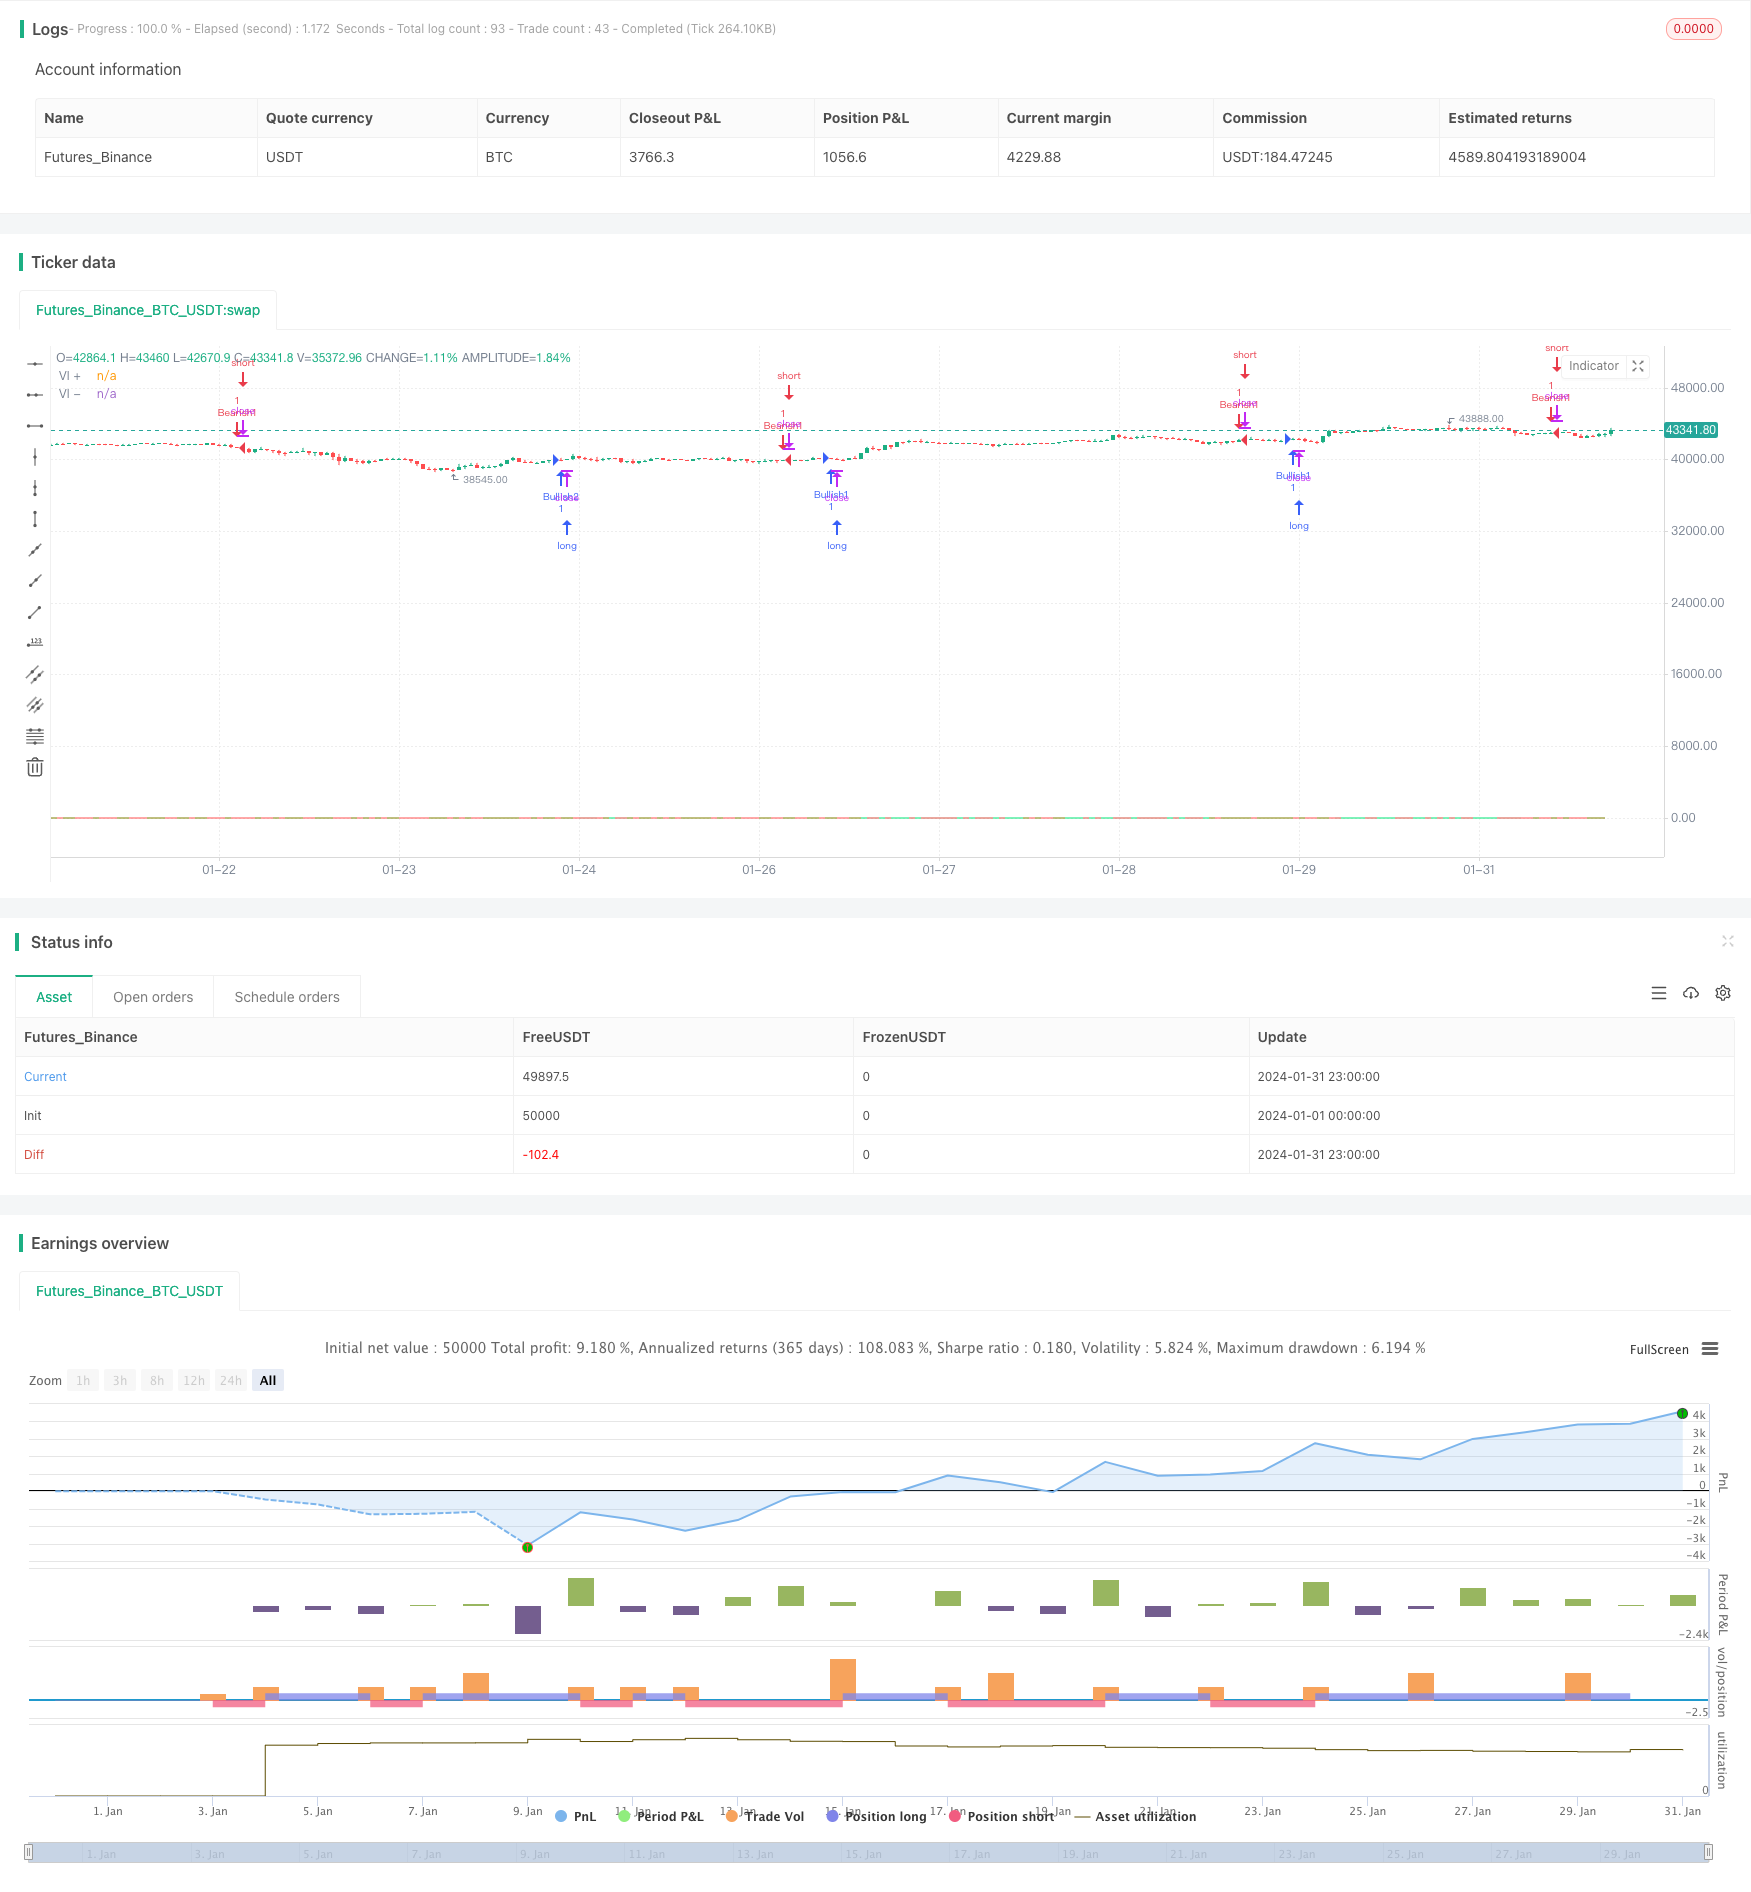
V字型反転指標に基づくSMA戦略

概要
V型反転指数SMA策略は,株価の14日間の最高値と前日の最低値の絶対差を計算し,14日間の最低値と前日の最高値の絶対差を計算し,その14日間の簡易移動平均をそれぞれ計算し,VI+とVI-曲線を形成する.VI+をVI-に突破すると多頭信号.VI-をVI+に突破すると空頭信号.
戦略原則
この戦略の核心指標は,VI+とVI−である.VI+は多頭力を表し,VI−は空頭力を表している.具体的計算式は以下の通りである.
VMP = SUM(ABS(HIGH - LOW[1]),14)
VMM = SUM(ABS(LOW - HIGH[1]),14)
STR = SUM(ATR(1),14)
VI+ = VMP/STR
VI- = VMM/STR
曲線の振動を取り除くために,VI+とVI-に対して14日間の単純移動平均を計算し,SMA ((VI+) とSMA ((VI-) を得ます.SMA ((VI+) の上を通過すると多頭信号が生じ,SMA ((VI-) の下を通過すると空頭信号が生じます.
さらに,戦略は,VI+とVI-の上下状態を組み合わせてトレンドを判断し,フィルタリングを行い,下下トレンドのときだけ多めにし,上下トレンドのとき空っぽにする.
優位分析
この戦略は,トレンド状態とVI指数の金叉死叉を組み合わせて,偽信号を効果的にフィルターして,利益の確率を高めます. 単純な移動平均戦略と比較して,その突破信号はより信頼性が高くなります.
リスク分析
この戦略には2つのリスクがあります.
VI指数は,特定の周期で誤導信号を生じます. このとき,トレンドフィルターとストップダスの組み合わせでリスクを制御する必要があります.
取引手数料やスライドポイントのコストが高い市場は,この戦略には適せず,利益の余地が大幅に減少します.
最適化の方向
この戦略は以下の点で最適化できます.
VI指標の周期パラメータを最適化し,最適なパラメータ組み合わせを探します.
誤った信号を自動識別し,信号の質を向上させるための機械学習の方法.
ストップ・ロスと資金管理を組み合わせて,単一取引の損失を制御する最適化退出メカニズム
取引品種の選択を最適化し,取引コストが低い市場を選択する.
要約する
V型逆転指標に基づくSMA戦略は,VI+およびVI-指標を計算してトレンドの状態と組み合わせて買い売りのタイミングを判断する,より信頼性の高いトレンド追跡戦略である.この戦略の優点は,信号品質が良いこと,ノイズを効果的にフィルターすることにある.しかし,被套のリスクも存在し,市場の変化に適応するために継続的に最適化する必要がある.
/*backtest
start: 2024-01-01 00:00:00
end: 2024-01-31 23:59:59
period: 1h
basePeriod: 15m
exchanges: [{"eid":"Futures_Binance","currency":"BTC_USDT"}]
*/

//@version=4
//@author=SIDD
//Sidd-Vortex strategy is using Vortex formula  to generate 4 signals Bullish1 Bullish2 and Bearish1 Bearish2.

//Bullish1 signal is getting generated when smooth ma of VIP is crossing over smooth ma of VIM and smooth VIM is falling from previous bar smooth VIM

//Bullish2 signal is getting generated when smooth ma of VIP is crossing over smooth ma of VIM and smooth VIP is rising from previous bar smooth VIP

//Bearish1 signal is getting generated when smooth ma of VIM is crossing over smooth ma of VIP and smooth VIP is falling from previous bar smooth VIP

//Bearish2 signal is getting generated when smooth ma of VIM is crossing over smooth ma of VIP and smooth VIM is rising from previous bar smooth VIM

//This strategy can be converted into study un-commenting the plotshape and 15th line strategy replace with study and overlay=false

strategy(title = "SIDD-Vortex", shorttitle="SIDD-VORTEX", format=format.price, precision=4,overlay=true)
period_ = input(14, title="Period", minval=2)
len = input(14, minval=1, title="WMA Length")

VMP = sum( abs( high - low[1]), period_ ) // sum of absolute current high and previous low with 14 period default
VMM = sum( abs( low - high[1]), period_ ) // sum of absolute current low and previous high with 14 period default
STR = sum( atr(1), period_ )  //sum of daily atr for 14 days
VIP = VMP / STR
VIM = VMM / STR

simpleMAVIP=wma(VIP, len)
smmaVIP = 0.0
smmaVIP := na(smmaVIP[1]) ? simpleMAVIP : (smmaVIP[1] * (len - 1) + VIP) / len // finding the Smoothing average

simpleMAVIM=wma(VIM, len)
smmaVIM = 0.0
smmaVIM := na(smmaVIM[1]) ? simpleMAVIM : (smmaVIM[1] * (len - 1) + VIM) / len // finding the Smoothing average


risingVIP = rising(smmaVIP, 1)
fallingVIP = falling(smmaVIP, 1)

lineColorVIP = smmaVIP > 0.95 and risingVIP  ? color.lime : smmaVIP > 0.95 ? #d65240 : smmaVIP < 0.95 and fallingVIP ? color.red : color.olive

risingVIM = rising(VIM, 1)
fallingVIM = falling(VIM, 1)

lineColorVIM = smmaVIM > 0.95 and risingVIM  ? color.red : smmaVIM > 0.95 ? color.olive : smmaVIM < 0.95 and fallingVIM ? color.lime : #d65240

plot(VIP, title="VI +", color=lineColorVIP)
plot(VIM, title="VI -", color=lineColorVIM)

longCondition = crossover(smmaVIP,smmaVIM)
shortCondition = crossover(smmaVIM,smmaVIP)


if (longCondition and fallingVIM)
    strategy.entry("Bullish1", strategy.long)
if (shortCondition and fallingVIP)
    strategy.entry("Bearish1", strategy.short)

if (longCondition and risingVIP)
    strategy.entry("Bullish2", strategy.long)
if (shortCondition and risingVIM)
    strategy.entry("Bearish2", strategy.short)

//plotshape(longCondition and fallingVIM, color=color.lime, location=location.belowbar, style=shape.triangleup,size= size.large,text="Bullish",offset=0,textcolor=color.white)
//plotshape(longCondition and risingVIP, color=color.lime, location=location.belowbar, style=shape.labelup,size= size.large,text="Bullish",offset=0,textcolor=color.white)
//plotshape(Diff > 0 and direction>0, color=color.lime, location=location.belowbar, style=shape.arrowup,size= size.normal,offset=0)

//plotshape(shortCondition and fallingVIP  , color=color.red, location=location.abovebar, style=shape.triangledown, size= size.large,text="Bearish",offset=0,textcolor=color.white)
//plotshape( shortCondition and risingVIM  , color=color.red, location=location.abovebar, style=shape.labeldown, size= size.large,text="Bearish",offset=0,textcolor=color.white)


//band1 = hline(1.0  , title="Upper Line", linestyle=hline.style_dashed, linewidth=3, color=color.red)
//band0 = hline(0.5, title="Lower Line", linestyle=hline.style_dashed, linewidth=3, color=color.lime)
//fill(band1, band0, color=color.purple, transp=70)