
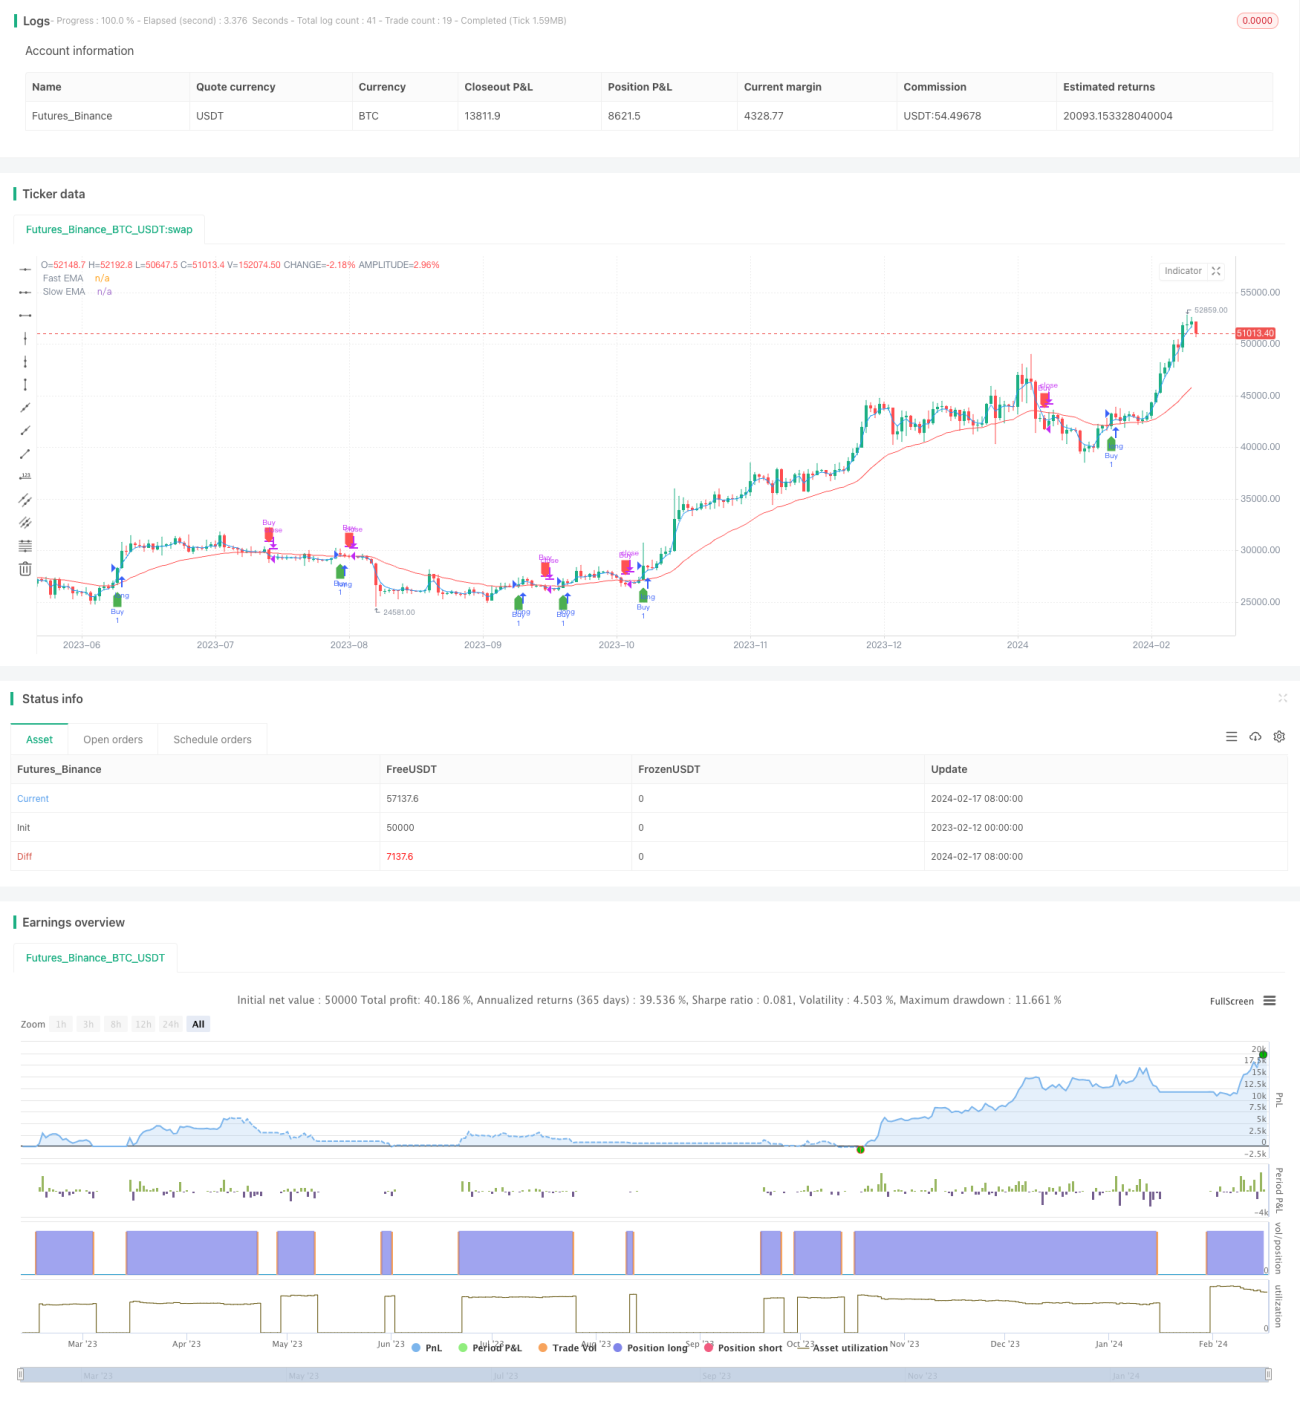
この戦略は,EMAの快線と慢線の金叉と死叉を使ってトレンドを判断し,預設のストップスコープ比率と組み合わせてトレンド追跡取引を実現する.この戦略は任意の時間周期に適用され,インデックスと個々の株のトレンドキャプチャを実現できる.
この戦略は,長さ3と30のEMA線を取引信号として使用する. 3EMAの上に30EMAを穿ったとき,価格は上昇し始め,買入条件を満たすことを示し,3EMAの下に30EMAを穿ったとき,価格は下降し始め,売出条件を満たすことを示します.
また,ストップ条件も設定されている. 価格上昇がストップの割合に合わせてストップに達すると,EXITとなります. これにより,より多くの利益をロックし,トレンドフォロー取引を実現できます.
この戦略は,全体的に非常に実用的なトレンド追跡戦略である. それは,単純なEMA指標を使用してトレンドの方向性を判断し,合理的な停止ルールを設定し,リスクを効果的に制御し,株とインデックスの中長期走行を長線で追跡するのに適しています.パラメータの最適化と配套インデックスの検証により,戦略の安定性とProfit Factorをさらに向上させることができます.
/*backtest
start: 2023-02-12 00:00:00
end: 2024-02-18 00:00:00
period: 1d
basePeriod: 1h
exchanges: [{"eid":"Futures_Binance","currency":"BTC_USDT"}]
*/
//@version=5
strategy("EMA Crossover Strategy with Target", shorttitle="EMACross", overlay=true)
// Define input parameters
fastLength = input(3, title="Fast EMA Length")
slowLength = input(30, title="Slow EMA Length")
profitPercentage = input(100.0, title="Profit Percentage")
// Calculate EMAs
fastEMA = ta.ema(close, fastLength)
slowEMA = ta.ema(close, slowLength)
// Plot EMAs on the chart
plot(fastEMA, color=color.blue, title="Fast EMA")
plot(slowEMA, color=color.red, title="Slow EMA")
// Buy condition: 3EMA crosses above 30EMA
buyCondition = ta.crossover(fastEMA, slowEMA)
// Sell condition: 3EMA crosses below 30EMA or profit target is reached
sellCondition = ta.crossunder(fastEMA, slowEMA) or close >= (strategy.position_avg_price * (1 + profitPercentage / 100))
// Target condition: 50 points profit
//targetCondition = close >= (strategy.position_avg_price + 50)
// Execute orders
// strategy.entry("Buy", strategy.long, when=buyCondition)
// strategy.close("Buy", when=sellCondition )
if (buyCondition)
strategy.entry("Buy", strategy.long)
if (sellCondition)
strategy.close("Buy")
// // Execute sell orders
// strategy.entry("Sell", strategy.short, when=sellCondition)
// strategy.close("Sell", when=buyCondition)
// Plot buy and sell signals on the chart
plotshape(series=buyCondition, title="Buy Signal", color=color.green, style=shape.labelup, location=location.belowbar)
plotshape(series=sellCondition, title="Sell Signal", color=color.red, style=shape.labeldown, location=location.abovebar)