モメンタムベースのトレンド同期戦略

概要
動態トレンド同期戦略は,相対的動態指数 (RMI) とカスタマイズされたpresentTrend指標を組み合わせた取引戦略である.この戦略は,動態分析とトレンド判断を組み合わせた多層のアプローチを採用し,トレーダーにより柔軟で敏感な取引機構を提供している.
戦略原則
RMI指標
RMI指数は,相対的強弱指数 (RSI) の変形であり,前段の価格変化に比べて価格上昇と下落の動力の大きさを測定する.計算式は次のとおりです.
RMI = 100 - 100/ (−1 + 平均上昇数 / 平均減少数)
- 平均値上がりは,過去N周期の平均値上がりです.
- 平均値が,過去N回分の平均値である.
RMI指数の値は0から100の間で,数値が大きいほど上昇勢いが強く,数値が小さいほど下落勢いが強くなる.
予測する.
presentTrend指標は,実際の波動範囲 ((ATR) と移動平均を組み合わせて,トレンドの方向と動的なサポートまたは抵抗点を判断する.計算式は以下のとおりです.
-
上線:移動平均 + (ATR × F)
-
下線:移動平均 - (ATR × F)
-
移動平均は,過去 M 周期の閉店価格の平均値です.
-
ATRは,過去M周期の平均的な真波動範囲である
-
Fは感度調整の倍数です.
価格がpresentTrendの上下軌道を突破すると,トレンドが変化し,入場または出場シグナルポイントが表示される.
戦略ロジック
応募条件:
- 追加入場:RMIが<unk>値 (例えば60) を越えたとき,強烈な牛市勢いを表示し,価格がpresentTrendより上線し,上昇傾向が確認されたとき,追加入場を行う.
- 空白:RMIが値下げ以下であるとき (例えば40),強い熊市勢いを示す,そして価格がpresentTrendの下線より低いとき,下向きのトレンドを確認すると,空白入場.
試合終了条件 (動的停止):
- 多出場:価格がpresentTrend下線またはRMIを中立領域に戻したときに出場し,牛の勢いが弱くなったことを示唆する.
- 離場:価格がpresentTrend上線を突破したり,RMIが中立地域に戻ったりすると,熊が弱くなったことを示す時に離場する.
ダイナミック・ストップダストの計算式:
- 複数のポジション:入場後,出場価格としてpresentTrend下線
- 空白: 入場後,出場価格としてpresentTrendの軌道に乗る
この戦略の優点は,RMIの動的判断と,presentTrendのトレンドと動的ストップを融合させ,トレンドを追跡しながら,リスクを効果的に制御できる点にある.
優位分析
この戦略の利点は以下の通りです.
- 多層の判断機構,動量指標とトレンド指標を組み合わせ,意思決定の効率化
- ダイナミック・ストップ・メカニズムで,市場の変化に応じてストップ・ポジションを調整し,リスクを効果的に制御する
- 個人的な好みに応じて,多額の取引,空白取引,双方向取引の選択肢があり,柔軟性があります.
- RMI パラメータは,異なる周期判断に適応して調整できます.
- presentTrend パラメータは,戦略の感受性を調整して制御できます.
リスク分析
この戦略にはいくつかのリスクがあります.
- 取引信号が多くなり,過剰取引が容易になり,取引コストと滑り場リスクが増加する
- 双重判断により,取引の機会を逃す可能性もある.
- 取引スタイルに適したパラメータを調整する
- 逆転取引を避けるために,大きなトレンドの方向を人工的に判断する必要があります.
適当な条件を緩和し,パラメータの組み合わせを最適化し,トレンド判断と組み合わせることで,上記のリスクを軽減することができます.
最適化の方向
この戦略は以下の方向から最適化できます.
- 波動率指標と組み合わせて,高波動時に誤入を避ける
- 能力の評価を向上させ,入学支援に十分な現有力を確保する
- ダイナミック・ストップの幅を最適化して,ストップを保証しながら,より大きな利益を得るために
- 再び入学する条件を追加し,トレンドの機会を最大限に活用する.
- パラメータ最適化と反省,最大限の利回りを得るための最適なパラメータを見つける
要約する
動態トレンド同期戦略は,動態指標とトレンド指標を考慮しながら,判断精度,リスク管理の優れた特性を有する多層の取引戦略である.この戦略は,個人の好みに応じて柔軟に調整することができ,深度最適化すると,トレンドキャプチャの優位性を充分に発揮することができる.これは推奨される取引戦略である.
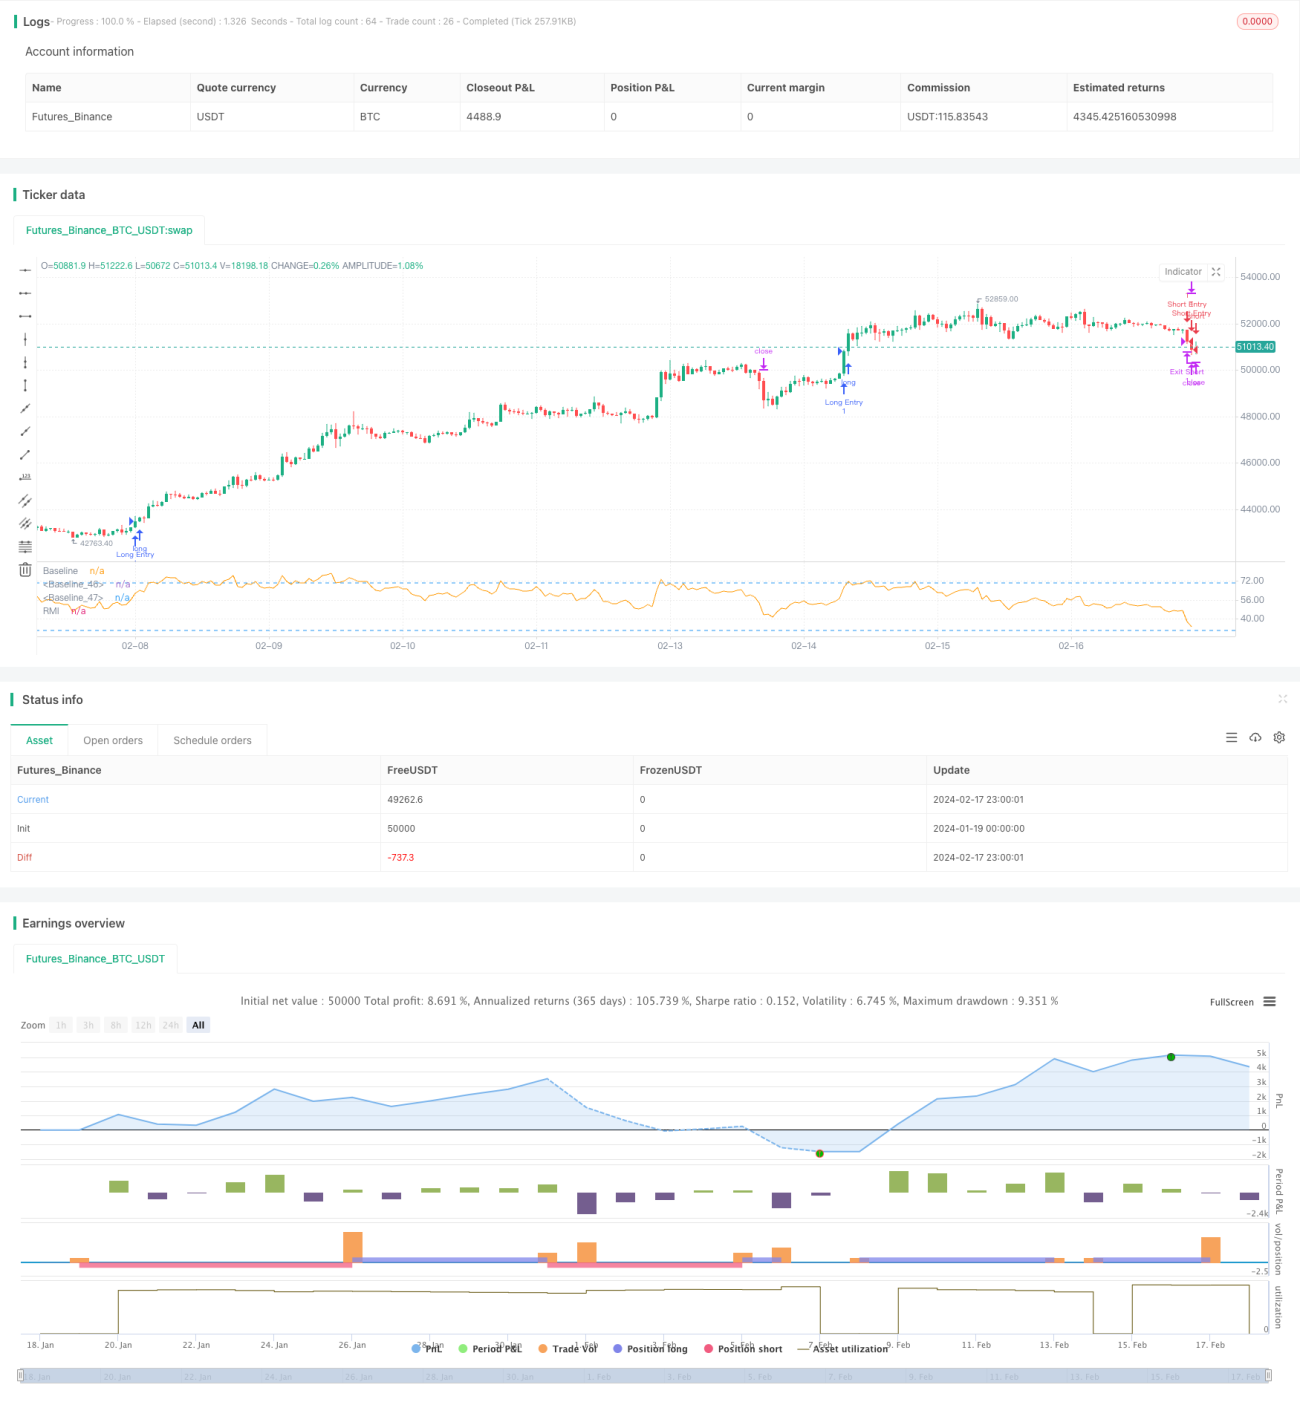
/*backtest
start: 2024-01-19 00:00:00
end: 2024-02-18 00:00:00
period: 1h
basePeriod: 15m
exchanges: [{"eid":"Futures_Binance","currency":"BTC_USDT"}]
*/

// This Pine Script™ code is subject to the terms of the Mozilla Public License 2.0 at https://mozilla.org/MPL/2.0/
// © PresentTrading

//@version=5- 1