ボリンジャーバンドブレイクアウト取引戦略
作成日:
2024-02-21 11:35:14
最終変更日:
2024-02-21 11:35:14
コピー:
0
クリック数:
726
1
フォロー
1750
フォロワー
概要
この戦略は,ブリン帯の指標設計に基づいており,価格がブリン帯を突破して軌道に乗るときは多行し,価格がブリン帯を突破して軌道に乗るときは空白し,トレンドフォロー戦略に属します.
戦略原則
- ブリン帯の中線,上線,下線を計算する
- 市場が急激に上昇すると,追加入場をする
- 閉店価格が下落した時に空白で入場
- 平仓条件:中軌道突破時に多枚を平にする,中軌道突破時に空枚を平にする
この戦略は,ブリン帯の波動範囲とトレンド方向を判断して,価格がブリン帯を突破して下軌道に乗るときは,トレンドの逆転のシグナルであると考え,このシグナルに基づいて入場は空きをする.中軌道近くはストップポジションとして,中軌道突破時にポジションを退出する.
優位分析
- ブリン帯の指標を用いて市場のトレンドとサポートレジスタンス点を判断する
- ブリン線を突破して下線に上がる可能性が高い.
- 明確な入場・出場ルール
リスク分析
- ブルインは偽信号の破綻のリスクを背負い,短期的な価格変動を招く可能性がある.
- ストップダストは,大きな場合,大きなものになる可能性があります.
リスク対策:
- 他の指標と組み合わせた判断の傾向
- パラメータを調整し,ブリン帯域を拡大
最適化の方向
- トレンド指数と組み合わせて,不必要な逆転を避ける
- ブリン帯のパラメータを動的に調整し,パラメータのサイズを最適化
要約する
この戦略は,ブリン帯の指標によって価格の傾向とサポートの抵抗点を判断し,ブリン帯の上下軌道突破点で入場し,ストップポイントはブリン帯の中軌道である.戦略の論理はシンプルで明確で,容易に実行できる.パラメータを調整するか,他の指標と組み合わせることで最適化することができ,トレンドの状況でより効果的です.
ストラテジーソースコード
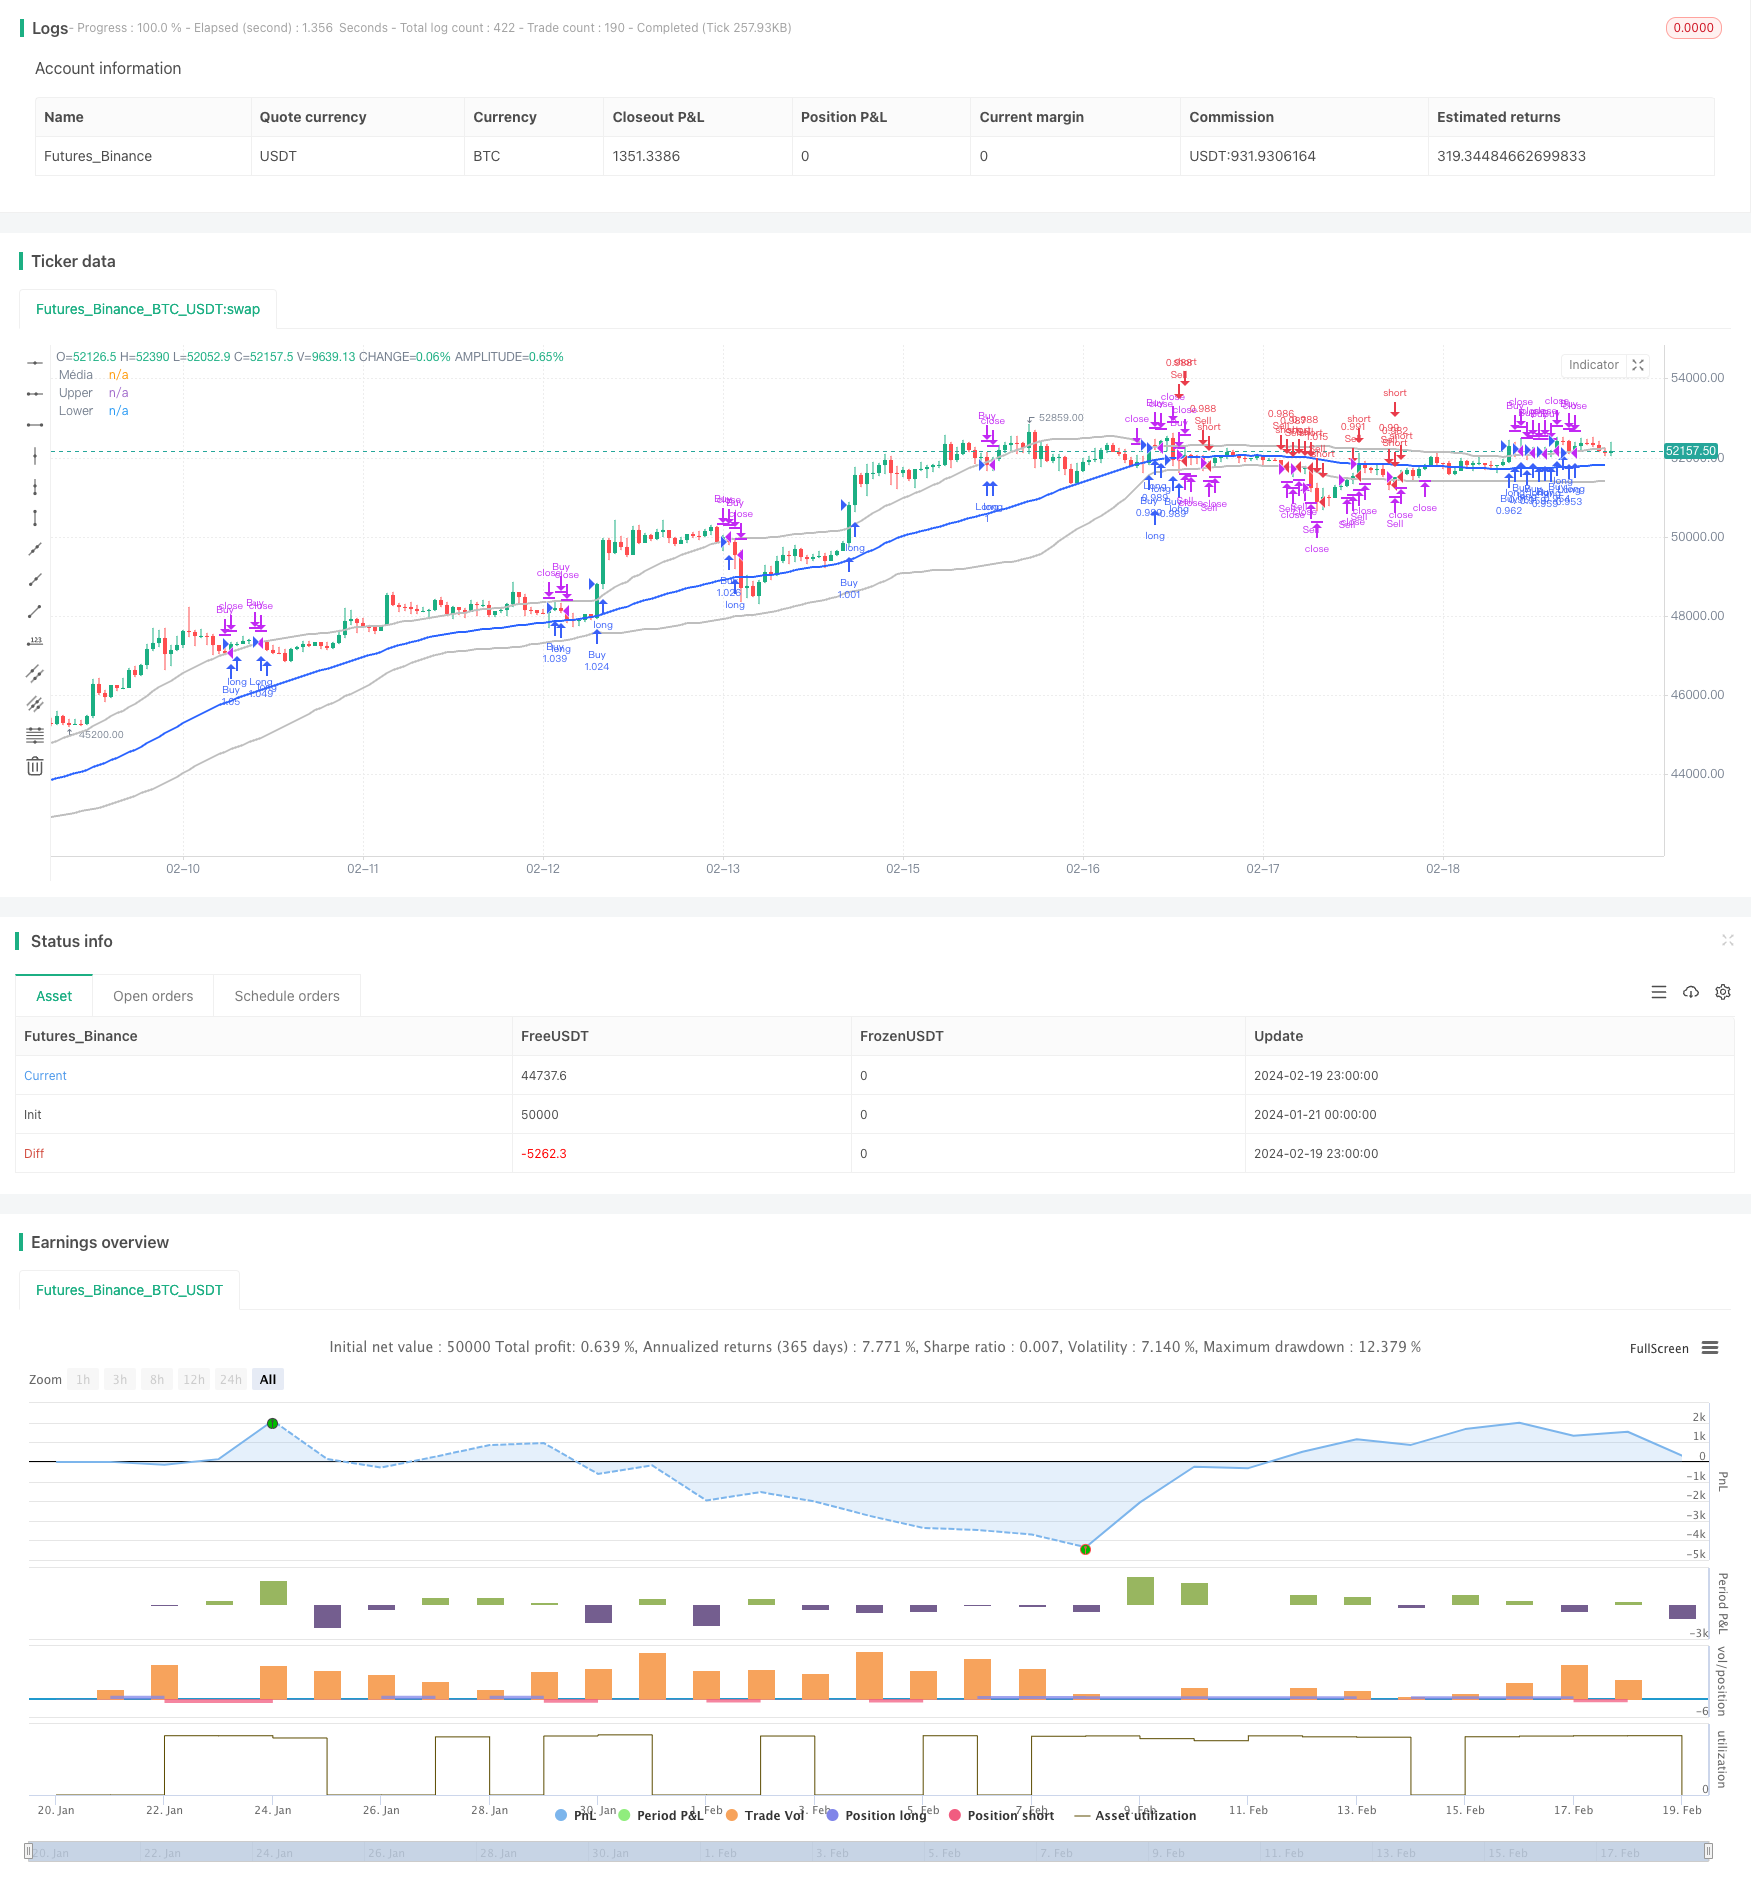
/*backtest
start: 2024-01-21 00:00:00
end: 2024-02-20 00:00:00
period: 1h
basePeriod: 15m
exchanges: [{"eid":"Futures_Binance","currency":"BTC_USDT"}]
*/

//@version=5
strategy("FFFDBTC", overlay=true,initial_capital = 100,commission_type =strategy.commission.percent,commission_value= 0.15,default_qty_value = 100,default_qty_type = strategy.percent_of_equity)
// === INPUT BACKTEST RANGE ===
FromMonth = input.int(defval=1, title="From Month", minval=1, maxval=12)
FromDay = input.int(defval=1, title="From Day", minval=1, maxval=31)
FromYear = input.int(defval=1972, title="From Year", minval=1972)
ToMonth = input.int(defval=1, title="To Month", minval=1, maxval=12)
ToDay = input.int(defval=1, title="To Day", minval=1, maxval=31)
ToYear = input.int(defval=9999, title="To Year", minval=2010)

// === FUNCTION EXAMPLE ===
start = timestamp(FromYear, FromMonth, FromDay, 00, 00)  // backtest start window
finish = timestamp(ToYear, ToMonth, ToDay, 23, 59)  // backtest finish window
window() => true
// Definindo tamanho da posição
position_size = strategy.equity
// Definir parâmetros das Bandas de Bollinger
length = input.int(51, "Comprimento")
mult = input.float(1.1, "Multiplicador")

// Calcular as Bandas de Bollinger
basis = ta.sma(close, length)
dev = mult * ta.stdev(close, length)
upper = basis + dev
lower = basis - dev
// Definir condições de entrada e saída
entrada_na_venda = low < lower
saida_da_venda = high > lower and strategy.position_size < 0
entrada_na_compra = high > upper
saida_da_compra = low < upper and strategy.position_size > 0
shortCondition = close[1] < lower[1] and close > lower and close < basis
longCondition = close[1] > upper[1] and close < upper and close > basis

// Entrar na posição longa se a condição longCondition for verdadeira
if ((entrada_na_compra) and window() )
    strategy.entry("Buy", strategy.long)
//saida da compra
if (saida_da_compra)
    strategy.close("Buy")
//entrada na venda
if ((entrada_na_venda) and window() )
    strategy.entry("Sell", strategy.short)
//saida da venda
if (saida_da_venda)
    strategy.close("Sell")
if ((longCondition) and window())
    strategy.entry("Long", strategy.long)

// Entrar na posição curta se a condição shortCondition for verdadeira
if ((shortCondition) and window())
    strategy.entry("Short", strategy.short)

// Definir a saída da posição

strategy.exit("Exit_Long", "Long", stop=ta.sma(close, length), when = close >= basis)
strategy.exit("Exit_Short", "Short", stop=ta.sma(close, length), when = close <= basis)

// Desenhar as Bandas de Bollinger no gráfico
plot(basis, "Média", color=#2962FF, linewidth=2)
plot(upper, "Upper", color=#BEBEBE, linewidth=2)
plot(lower, "Lower", color=#BEBEBE, linewidth=2)