月の満ち欠けに基づく双方向取引戦略
作成日:
2024-02-21 16:15:25
最終変更日:
2024-02-21 16:15:25
コピー:
3
クリック数:
983
1
フォロー
1750
フォロワー
概要
この戦略は月相の変化に基づいて,新月時には多し,満月時には空し,双方向取引を実現する.
戦略原則
この策略はカスタム関数を使用して月相を計算し,日付に基づいて月相の年齢を正確に計算することができる.年齢が15歳未満なら新月,年齢が15歳以上で30歳未満なら満月である.策略は月相によって多空シグナルを行い,新月時に多開,満月時に空開,平仓時に正反対に,満月時に多開,新月時に平空開である.
ユーザは,新月多し,満月空しまたは新月空し,満月多しという2つの戦略を選択できます.戦略は,ブル変数を使用して,現在ポジションを保有しているかどうかを追跡します.信号が現れる前にポジションがないときに新しいポジションを開き,信号が反転すると現在のポジションを平らげる.戦略は,購入と販売の標識を視覚的に表示します.
優位分析
- 月相の周期性を利用して長線トレンドを捉える
- カスタマイズ可能なカラー,詰め込みなどのポリシーを表示します.
- 選択可能な双方向取引戦略
- オープンポジションのマークが表示され,操作が明確です.
- カスタマイズ可能な反射開始時間,最適化策略
リスク分析
- 月相周期が長いので,短線トレンドは捉えられません.
- 損失を制限できないため,大きな損失を招く可能性があります.
- 固定周期でパターンが形成されやすい
リスク対策:
- 他の指標と組み合わせて,多層取引を実現
- 損失防止の強化
- ポジション管理を最適化し,単一損失の影響を低減する
最適化の方向
この戦略は,以下の点で最適化できます.
- より多くの周期指標と組み合わせて,取引信号フィルターを形成し,戦略の安定性を向上させる
- ポジション管理モジュールを追加し,ポジションのサイズを最適化し,単一の損失の影響を軽減します.
- ストップ・モジュールを追加し,損失を拡大しないようにする
- ポジション開設とポジション条件の最適化,損失の軽減,勝利率の向上
要約する
この戦略は,月相の周期的法則を利用し,新月と満月に基づく二方向取引戦略を実現する.戦略は,明確な表示,カスタマイズ性が強く,長線トレンドを捕捉するのに適しています.しかし,損失を制限することができないので,リスクは大きいので,他の短期周期指標と組み合わせて使用することをお勧めします.さらに最適化するために,ポジションとストップ・マネジメントモジュールを追加します.
ストラテジーソースコード
/*backtest
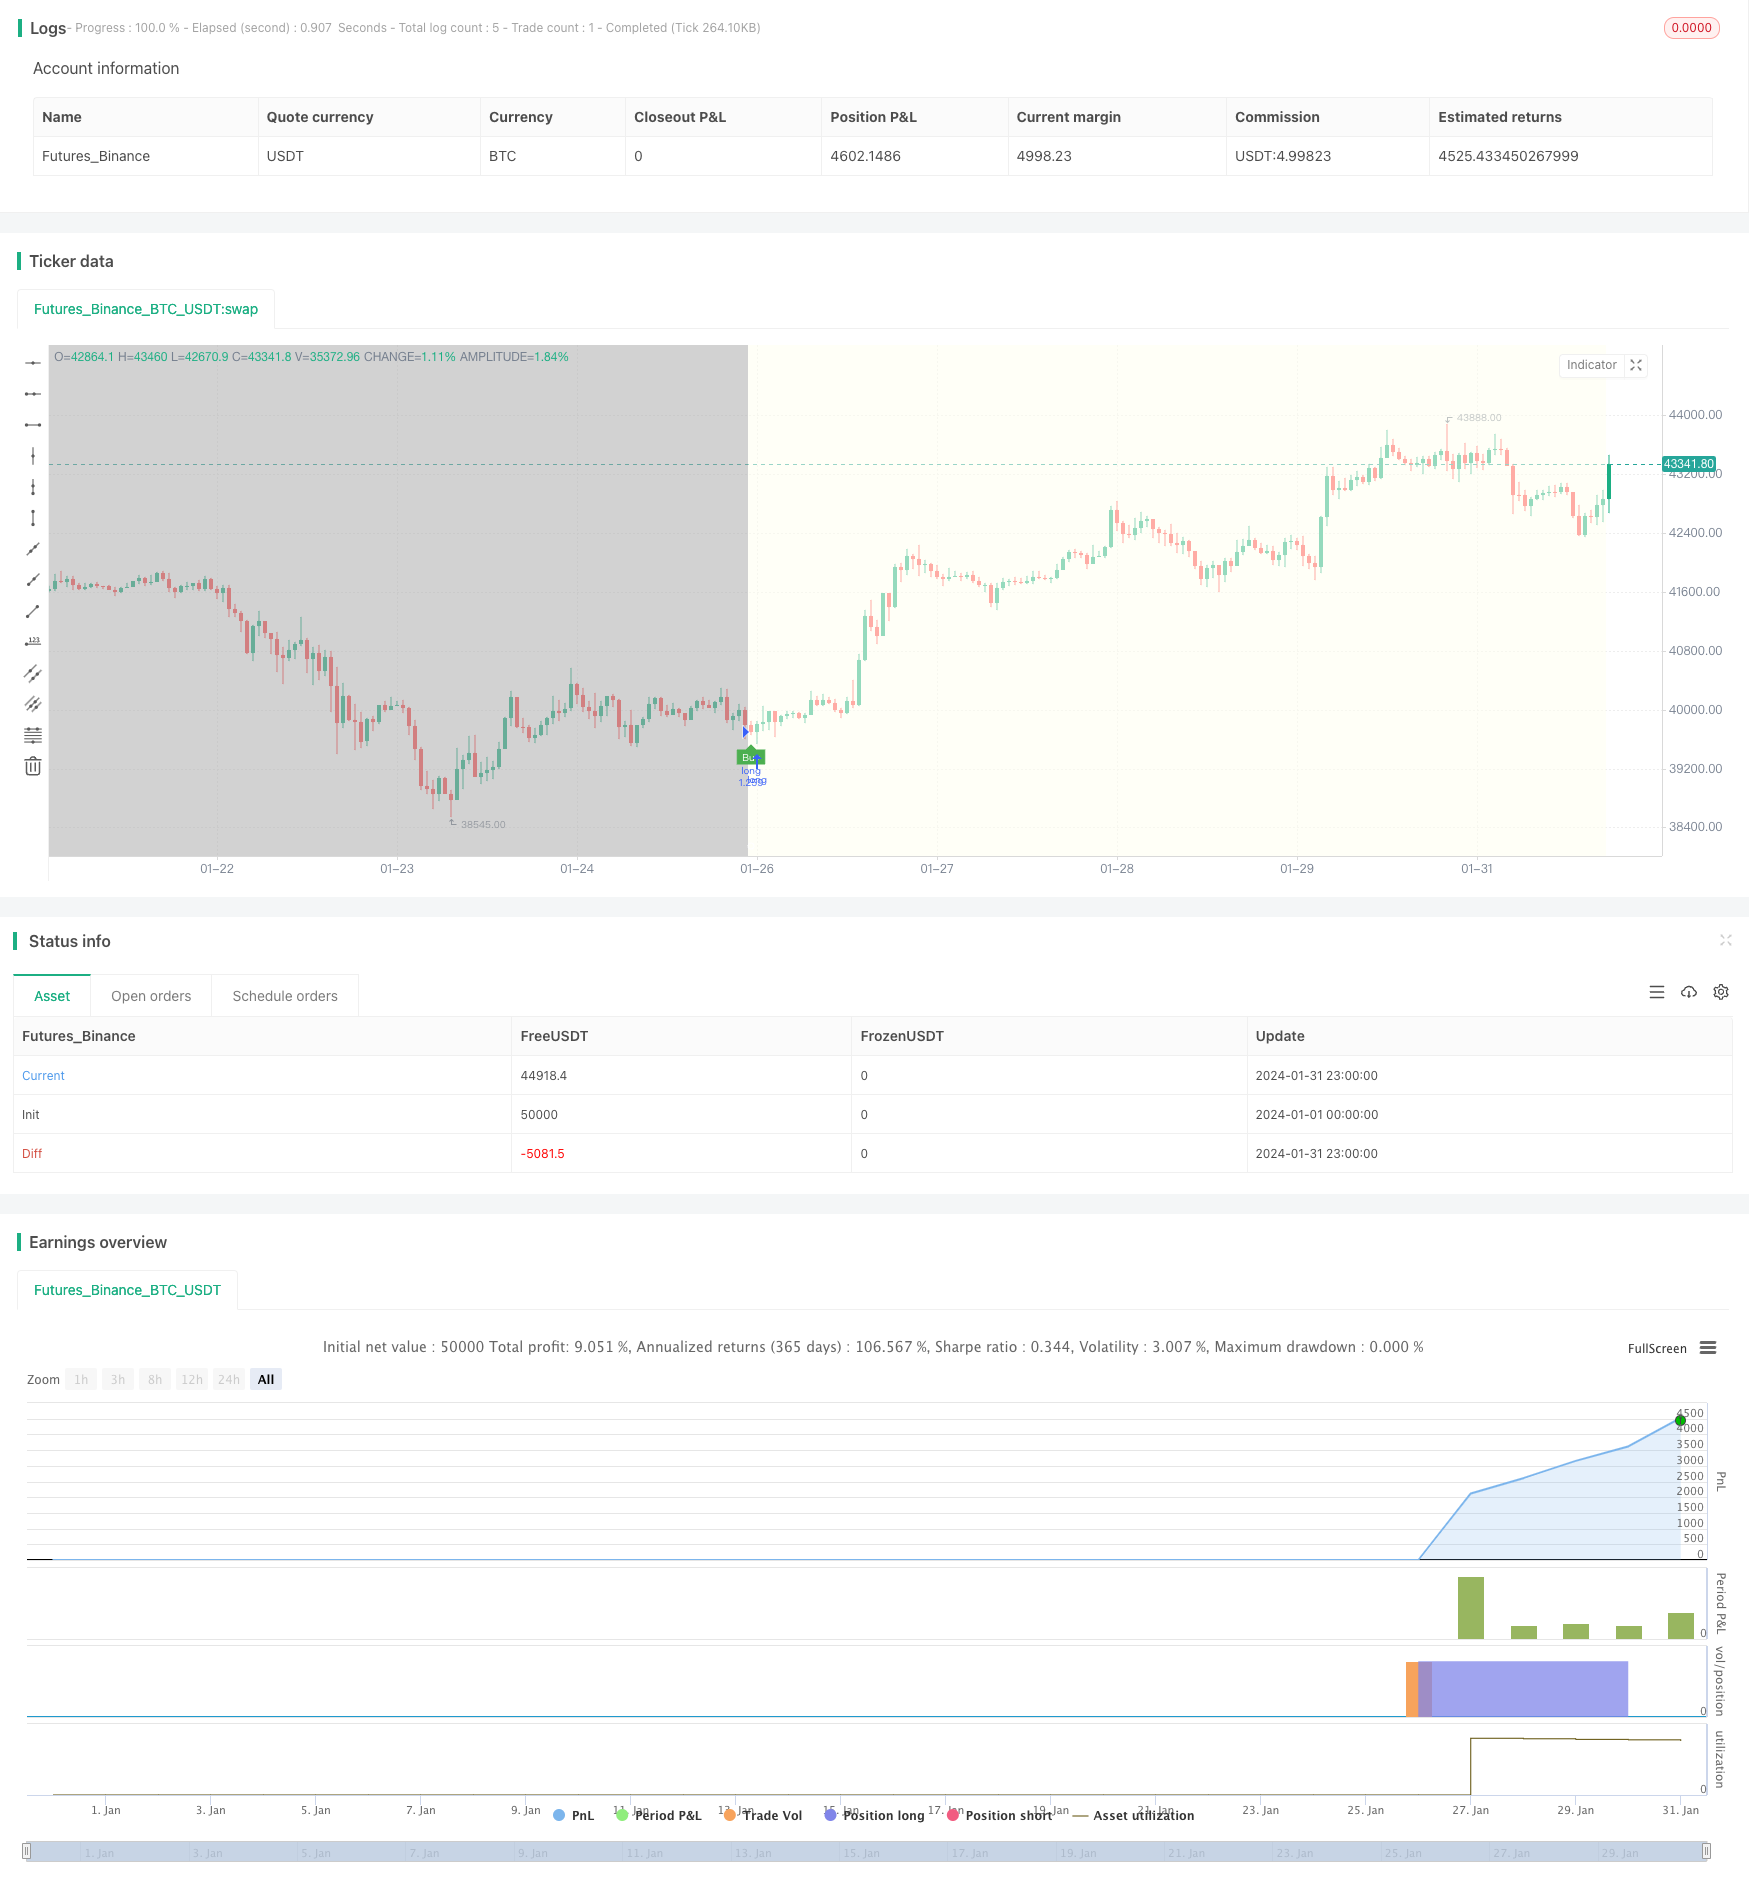
start: 2024-01-01 00:00:00
end: 2024-01-31 23:59:59
period: 1h
basePeriod: 15m
exchanges: [{"eid":"Futures_Binance","currency":"BTC_USDT"}]
*/
// This source code is subject to the terms of the Mozilla Public License 2.0 at https://mozilla.org/MPL/2.0/
// ---------------------------© paaax----------------------------
// ---------------- Author1: Pascal Simon (paaax) ----------------
// -------------------- www.pascal-simon.de ---------------------
// ---------------- www.tradingview.com/u/paaax/-----------------
// Source: https://gist.github.com/L-A/3497902#file-moonobject-js
// -------------------------© astropark--------------------------
// --------------- Author2: Astropark (astropark) ---------------
// -------------- https://bit.ly/astroparktrading ---------------
// -------------- www.tradingview.com/u/astropark/---------------
// @version=4
strategy(title="[astropark] Moon Phases [strategy]", overlay=true, pyramiding = 10, default_qty_type = strategy.percent_of_equity, default_qty_value = 100, initial_capital = 100000, currency = currency.USD, commission_value = 0.1)
// INPUT --- {
newMoonColor = input(color.black, "New Moon Color")
fullMoonColor = input(color.white, "Full Moon Color")
fillBackground = input(true, "Fill Background?")
newMoonBackgroundColor = input(#fffff0aa, "New Moon Background Color")
fullMoonBackgroundColor = input(#aaaaaaaa, "Full Moon Background Color")
//} --- INPUT
// FUNCTION --- {
normalize(_v) =>
x = _v
x := x - floor(x)
if x < 0
x := x + 1
x
calcPhase(_year, _month, _day) =>
int y = na
int m = na
float k1 = na
float k2 = na
float k3 = na
float jd = na
float ip = na
y := _year - floor((12 - _month) / 10)
m := _month + 9
if m >= 12
m := m - 12
k1 := floor(365.25 * (y + 4712))
k2 := floor(30.6 * m + 0.5)
k3 := floor(floor((y / 100) + 49) * 0.75) - 38
jd := k1 + k2 + _day + 59
if jd > 2299160
jd := jd - k3
ip := normalize((jd - 2451550.1) / 29.530588853)
age = ip * 29.53
//} --- FUNCTION
// INIT --- {
age = calcPhase(year, month, dayofmonth)
moon =
floor(age)[1] > floor(age) ? 1 :
floor(age)[1] < 15 and floor(age) >= 15 ? -1 : na
//} --- INIT
// PLOT --- {
plotshape(
moon==1,
"Full Moon",
shape.circle,
location.top,
color.new(newMoonColor, 20),
size=size.normal
)
plotshape(
moon==-1,
"New Moon",
shape.circle,
location.bottom,
color.new(fullMoonColor, 20),
size=size.normal
)
var color col = na
if moon == 1 and fillBackground
col := fullMoonBackgroundColor
if moon == -1 and fillBackground
col := newMoonBackgroundColor
bgcolor(col, title="Moon Phase", transp=10)
//} --- PLOT
// STRATEGY --- {
strategy = input("buy on new moon, sell on full moon", options=["buy on new moon, sell on full moon","sell on new moon, buy on full moon"])
longCond = strategy == "buy on new moon, sell on full moon" ? moon == -1 : moon == 1
shortCond = strategy == "buy on new moon, sell on full moon" ? moon == 1 : moon == -1
weAreInLongTrade = false
weAreInShortTrade = false
weAreInLongTrade := (longCond or weAreInLongTrade[1]) and shortCond == false
weAreInShortTrade := (shortCond or weAreInShortTrade[1]) and longCond == false
buySignal = longCond and weAreInLongTrade[1] == false
sellSignal = shortCond and weAreInShortTrade[1] == false
showBuySellSignals = input(defval=true, title = "Show Buy/Sell Signals")
longEnabled = input(true, title="Long enabled")
shortEnabled = input(true, title="Short enabled")
analysisStartYear = input(2017, "Backtesting From Year", minval=1980)
analysisStartMonth = input(1, "And Month", minval=1, maxval=12)
analysisStartDay = input(1, "And Day", minval=1, maxval=31)
analysisStartHour = input(0, "And Hour", minval=0, maxval=23)
analysisStartMinute = input(0, "And Minute", minval=0, maxval=59)
analyzeFromTimestamp = timestamp(analysisStartYear, analysisStartMonth, analysisStartDay, analysisStartHour, analysisStartMinute)
plotshape(showBuySellSignals and buySignal, title="Buy Label", text="Buy", location=location.belowbar, style=shape.labelup, size=size.tiny, color=color.green, textcolor=color.white, transp=0)
plotshape(showBuySellSignals and sellSignal, title="Sell Label", text="Sell", location=location.abovebar, style=shape.labeldown, size=size.tiny, color=color.red, textcolor=color.white, transp=0)
strategy.entry("long", strategy.long, when = time > analyzeFromTimestamp and buySignal and longEnabled)
strategy.entry("short", strategy.short, when = time > analyzeFromTimestamp and sellSignal and shortEnabled)
strategy.close("long", when = sellSignal)
strategy.close("short", when = buySignal)
//} --- STRATEGY