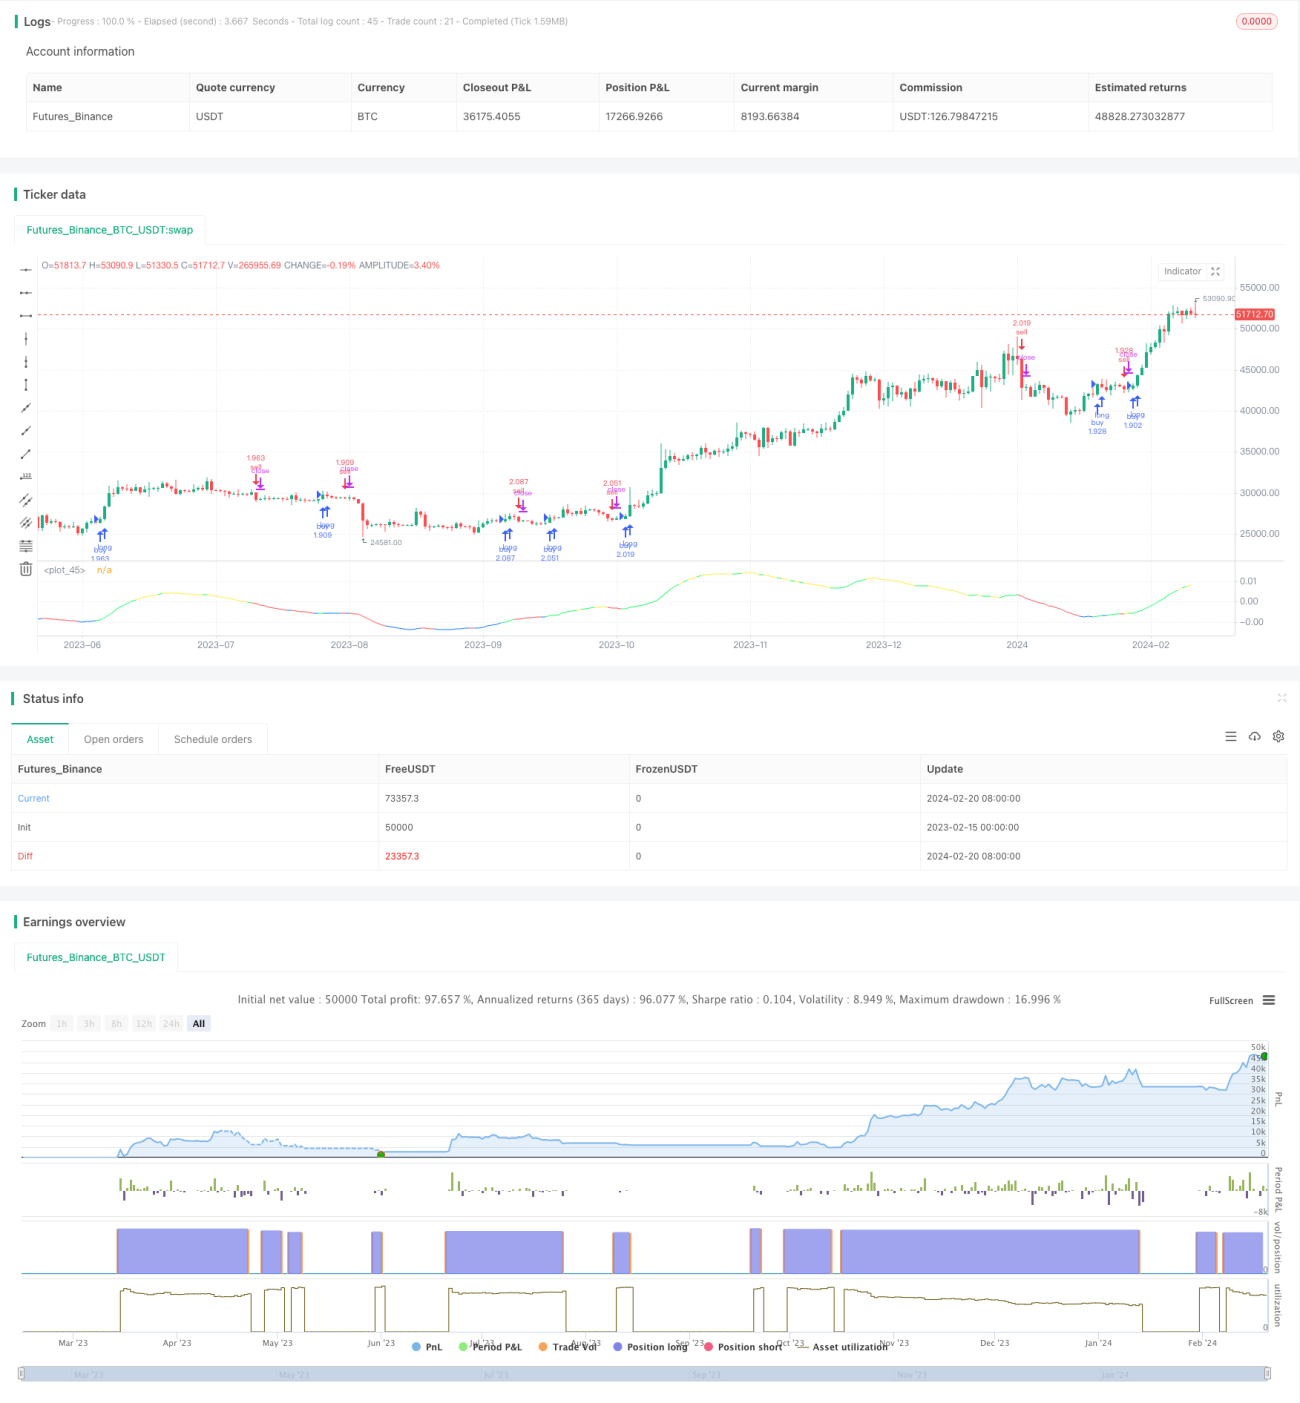
MyQuantトレンド識別戦略は,ビットコインの日々の取引に使用される戦略である.この戦略は,価格の移動平均とその一階および二階導関数を計算することによって市場トレンドを識別し,それに基づいて買入または販売の決定を策定する.
この戦略は,まず,価格の自己適応移動平均 ((ALMA) とその一級導関数と二級導関数を計算する.一級導関数は価格の変動速度を反映し,二級導関数は価格曲線を反映する.一級および二級導関数の値に基づいて,現在上昇傾向,下降傾向または揺れ期にあることを判断する.そして,株式指標と組み合わせて,購入または販売条件が満たされているかどうかを判断する.
具体的には,以下のような指標を計算しています.
買取条件が満たされたとき,CAUSED.Accumulation/Distribution BandsとCaused Exposure Top and Bottom Finderの信号に基づいて買取した株式の数を計算する. 売る条件が満たされたとき,全ポジションを売る.
この戦略は,トレンドと指標判断を組み合わせて,市場トレンドの転換点を効果的に識別することができる.価格の第一段階および第二段階導関数を使用してトレンドを判断し,価格の揺れの影響を受けないようにし,信号をより明確にする.一般的な移動平均戦略と比較して,判断精度が高い優位性がある.
この戦略は,取引時間帯の選択とパラメータの調整に非常に敏感である.時間帯の選択が間違って,重要な価格の転換点をカバーできなければ,戦略の効果が悪くなる.指標パラメータの設定が間違っていれば,買入販売シグナルがより多くのノイズの影響を受け,戦略の収益に影響を与える.さらに,戦略の予備のストップ・損失条件も最終的な収益に影響を与える.
この戦略をさらに最適化するには,以下のポイントを考慮する必要があります.
MyQuantトレンド識別策は,価格の自適性移動平均を1次および2次導関数計算することによって,ビットコインの市場トレンドを効果的に識別し,それに応じて買い売りの決定を下す.この策は,複数の指標を組み合わせて判断し,信号が過剰なノイズによって干渉されないようにする.さらに時間とパラメータの最適化により,この策の効果も向上することができる.
/*backtest
start: 2023-02-15 00:00:00
end: 2024-02-21 00:00:00
period: 1d
basePeriod: 1h
exchanges: [{"eid":"Futures_Binance","currency":"BTC_USDT"}]
*/
// This source code is subject to the terms of the Mozilla Public License 2.0 at https://mozilla.org/MPL/2.0/
// © spacekadet17
//
//@version=5
strategy(title="Trend Identifier Strategy", shorttitle="Trend Identifier Strategy", format=format.price, precision=4, overlay = false, initial_capital = 1000, pyramiding = 10, default_qty_type = strategy.percent_of_equity, default_qty_value = 100, commission_type = strategy.commission.percent, commission_value = 0.03)
//start-end time
startyear = input.int(2020,"start year")
startmonth = input.int(1,"start month")
startday = input.int(1,"start day")
endyear = input.int(2025,"end year")
endmonth = input.int(1,"end month")
endday = input.int(1,"end day")
timeEnd = time <= timestamp(syminfo.timezone,endyear,endmonth,endday,0,0)
timeStart = time >= timestamp(syminfo.timezone,startyear,startmonth,startday,0,0)
choosetime = input(false,"Choose Time Interval")
condTime = (choosetime ? (timeStart and timeEnd) : true)
// time frame?
tfc = 1
if timeframe.isdaily
tfc := 24
// indicators: price normalized alma, and its 1st and 2nd derivatives
ema = ta.alma(close,140,1.1,6)
dema = (ema-ema[1])/ema
stodema = ta.ema(ta.ema(ta.stoch(dema,dema,dema,100),3),3)
d2ema = ta.ema(dema-dema[1],5)
stod2ema = ta.ema(ta.ema(ta.stoch(d2ema,d2ema,d2ema,100),3),3)
ind = (close-ta.ema(close,120*24/tfc))/close
heat = ta.ema(ta.stoch(ind,ind,ind,120*24/tfc),3)
index = ta.ema(heat,7*24/tfc)
//plot graph
green = color.rgb(20,255,100)
yellow = color.yellow
red = color.red
blue = color.rgb(20,120,255)
tcolor = (dema>0) and (d2ema>0)? green : (dema>0) and (d2ema<0) ? yellow : (dema < 0) and (d2ema<0) ? red : (dema < 0) and (d2ema>0) ? blue : color.black
demaema = ta.ema(dema,21)
plot(demaema, color = tcolor)
//strategy buy-sell conditions
cond1a = strategy.position_size <= 0
cond1b = strategy.position_size > 0
if (condTime and cond1a and ( ( ((tcolor[1] == red and demaema<0.02) or (tcolor[1] == blue and demaema < 0.02) or (tcolor[1] == yellow and demaema>-0.02) ) and tcolor == green) or (tcolor[1] == red and tcolor == blue and demaema < -0.01) ) and index<85 and ind<0.4)
strategy.entry("buy",strategy.long, (strategy.equity-strategy.position_size*close)/1/close)
if (condTime and cond1b and ( (((tcolor[1] == yellow and demaema > -0.02) or (tcolor[1] == blue and demaema < 0.02) or (tcolor[1] == green and demaema < 0.02)) and tcolor == red) or (tcolor[1] == green and tcolor == yellow and demaema > 0.015) ) and index>15 and ind>-0.1)
strategy.order("sell",strategy.short, strategy.position_size)