
この戦略は,超トレンド指数,双指数移動平均,ブリン帯など,複数の技術指標を統合し,各指標の優位性を活用し,より正確な取引シグナルを実現します.
策略は,12周期ATRと価格の平均値を計算し,超トレンドの上線と下線を計算し,価格の突破上線と下線に基づいて多頭と空頭信号を判断する.同時に,200周期の二次指数移動平均をトレンドの判断の補助指標として使用する.さらに,策略はブリンを用い,市場への入場と停止の最適なタイミングを決定する.
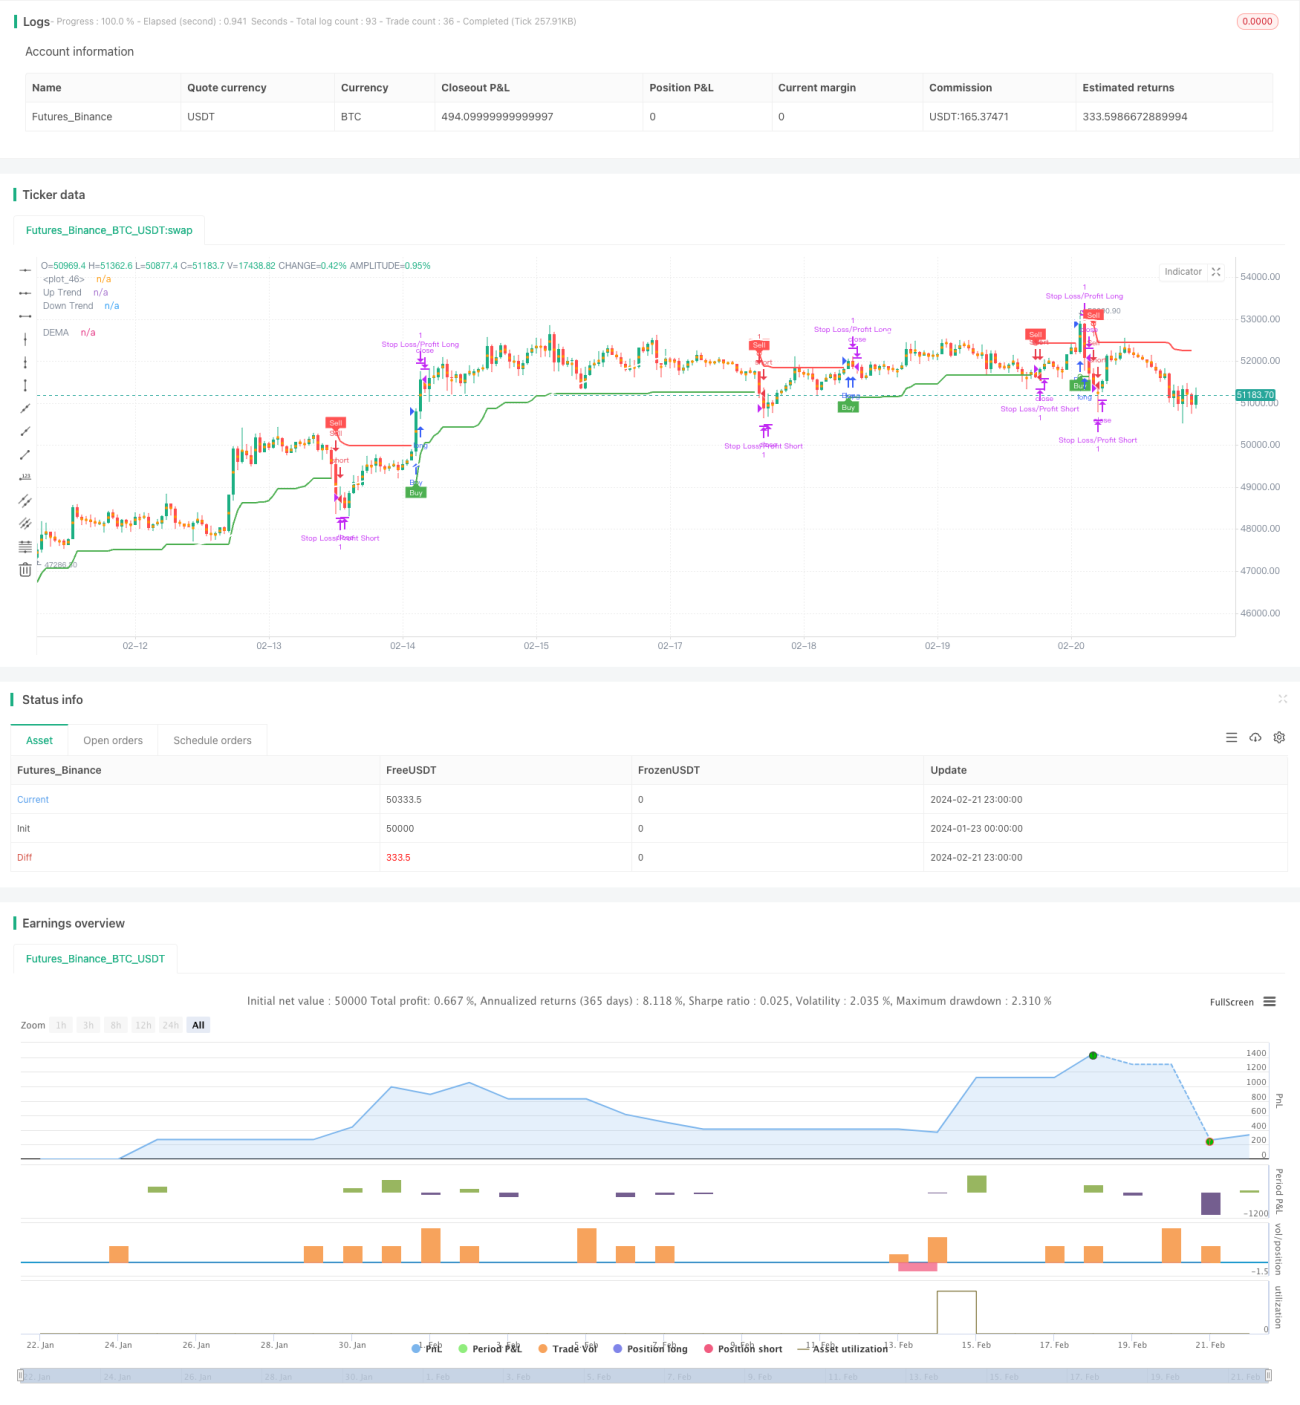
価格が上からトレンドを突破すると,BuyまたはSellの標識と文字が描かれます. 同時に,モバイル端の信号が送信されます.
双指数移動平均は,価格曲線の上または下に描かれ,白色で表示される. それは,全体的なトレンドの方向を判断するために使用される.
ブリン帯は,入場と止まりの最適なタイミングを探すために使用される.その上下軌道は,価格変動の周りに通路を形成し,価格が通常の範囲から外れているとき,つまり大きなタイミングを超えたときを判断するために使用することができます.
市場に出回った後,戦略は,利益をロックまたは損失を減らすために,ストップ・ロスとストップ・ストップの方法を使用します. ストップ・ロス価格とストップ・ストップ価格を設定することによって,自動減仓を実現します.
この戦略は,複数の指標を統合し,それぞれの指標の優位性を最大限に活用し,より正確な取引シグナルを実現します.
超トレンドは市場の騒音をフィルターする能力を持ち,取引を頻繁に避ける.双指数移動平均は,大まかなトレンドを判断し,逆行取引を避ける.ブリン帯は,入場と止損の最適なタイミングを把握できる.
モバイル端のシグナルを使用すると,取引の提示をタイムリーに取得できます.自動ストップ・ストップ・ロスは,利益をロックし,損失を減らすことができます.
策略が複数の指標を統合するので,策略の複雑性が増加し,誤差の可能性も増加する.指標設定は,見逃した取引機会や誤った信号を引き起こす可能性があります.
さらに,止損設定が過度に激進化されても,損失が拡大する可能性があります.モバイル端末の信号の安定性も,間に合う利得止損の効果に影響します.
異なるパラメータの設定をテストして最適なパラメータの組み合わせを見つけることができます.また,異なる市場に応じてパラメータを調整することもできます.
誤った信号の確率を減らすために,一部の指標のみを使用したり,他の補助指標を追加して最適化したりすることができます.
停止および停止条件は,追跡停止または部分停止などの方法で調整することもできます.
この戦略は,複数の技術指標を総合的に適用し,取引信号の判断を実現する優位性があり,強力な実用性を持っています.しかし,一定のリスクに直面しています.実際に自律的に使用し,安定した収益を得るために,継続的にテストと最適化が必要です.
/*backtest
start: 2024-01-23 00:00:00
end: 2024-02-22 00:00:00
period: 1h
basePeriod: 15m
exchanges: [{"eid":"Futures_Binance","currency":"BTC_USDT"}]
*/
// This Pine Script™ code is subject to the terms of the Mozilla Public License 2.0 at https://mozilla.org/MPL/2.0/
// © zhuenrong
//@version=4
strategy("Supertrend + DEMA + Bollinger Bands", overlay=true)
// Input parameters for Supertrend
atrLength = input(title="ATR Period", type=input.integer, defval=12)
src = input(hl2, title="Source")
multiplier = input(title="ATR Multiplier", type=input.float, step=0.1, defval=3.0)
changeATR = input(title="Change ATR Calculation Method?", type=input.bool, defval=true)
showSupertrend = input(title="Show Supertrend Indicator?", type=input.bool, defval=true)
// Input parameters for DEMA
demaLength = input(200, title="DEMA Period")
showDEMA = input(title="Show DEMA Indicator?", type=input.bool, defval=true)
// Calculate ATR for Supertrend
atr2 = sma(tr, atrLength)
atr = changeATR ? atr(atrLength) : atr2
// Calculate Supertrend
up = src - (multiplier * atr)
up1 = nz(up[1], up)
up := close[1] > up1 ? max(up, up1) : up
dn = src + (multiplier * atr)
dn1 = nz(dn[1], dn)
dn := close[1] < dn1 ? min(dn, dn1) : dn
trend = 1
trend := nz(trend[1], trend)
trend := trend == -1 and close > dn1 ? 1 : trend == 1 and close < up1 ? -1 : trend
// Plot Supertrend
upPlot = plot(showSupertrend ? (trend == 1 ? up : na) : na, title="Up Trend", style=plot.style_linebr, linewidth=2, color=color.new(color.green, 0))
buySignal = trend == 1 and trend[1] == -1
plotshape(buySignal ? up : na, title="UpTrend Begins", location=location.absolute, style=shape.circle, size=size.tiny, color=color.new(color.green, 0))
plotshape(buySignal ? up : na, title="Buy", text="Buy", location=location.absolute, style=shape.labelup, size=size.tiny, color=color.new(color.green, 0), textcolor=color.new(color.white, 0))
dnPlot = plot(showSupertrend ? (trend == 1 ? na : dn) : na, title="Down Trend", style=plot.style_linebr, linewidth=2, color=color.new(color.red, 0))
sellSignal = trend == -1 and trend[1] == 1
plotshape(sellSignal ? dn : na, title="DownTrend Begins", location=location.absolute, style=shape.circle, size=size.tiny, color=color.new(color.red, 0))
plotshape(sellSignal ? dn : na, title="Sell", text="Sell", location=location.absolute, style=shape.labeldown, size=size.tiny, color=color.new(color.red, 0), textcolor=color.new(color.white, 0))
mPlot = plot(ohlc4, title="", style=plot.style_circles, linewidth=0)
longFillColor = (trend == 1 ? color.new(color.green, 80) : color.new(color.white, 0))
shortFillColor = (trend == -1 ? color.new(color.red, 80) : color.new(color.white, 0))
fill(mPlot, upPlot, title="UpTrend Highlighter", color=longFillColor)
fill(mPlot, dnPlot, title="DownTrend Highlighter", color=shortFillColor)
// Alert conditions
alertcondition(buySignal, title="Custom Supertrend Buy", message="Custom Supertrend Buy!")
alertcondition(sellSignal, title="Custom Supertrend Sell", message="Custom Supertrend Sell!")
// Calculate DEMA
ema1 = ema(close, demaLength)
dema = 2 * ema1 - ema(ema1, demaLength)
// Plot DEMA with white color
plot(showDEMA ? dema : na, color=color.new(color.white, 0), title="DEMA", linewidth=2)
// Add push notification on mobile if buy and sell occurred
if (buySignal)
strategy.entry("Buy", strategy.long)
//strategy.exit("Sell")
//alert("Buy Signal - Supertrend")
if (sellSignal)
strategy.entry("Sell", strategy.short)
//strategy.exit("Cover")
//alert("Sell Signal - Supertrend")
// === Stop LOSS ===
if strategy.position_size>0
strategy.exit("Stop Loss/Profit Long","Buy", stop=strategy.position_avg_price*100, limit=strategy.position_avg_price*1.1)
if strategy.position_size<0
strategy.exit("Stop Loss/Profit Short","Sell", stop=strategy.position_avg_price*100, limit=strategy.position_avg_price*1.1)