ボリンジャーバンドとMACDに基づく定量取引戦略


作成日: 2024-02-23 14:30:30 最終変更日: 2024-02-23 14:30:30
コピー: 0 クリック数: 708
1
フォロー
1617
フォロワー

ボリンジャーバンドとMACDに基づく定量取引戦略

概要

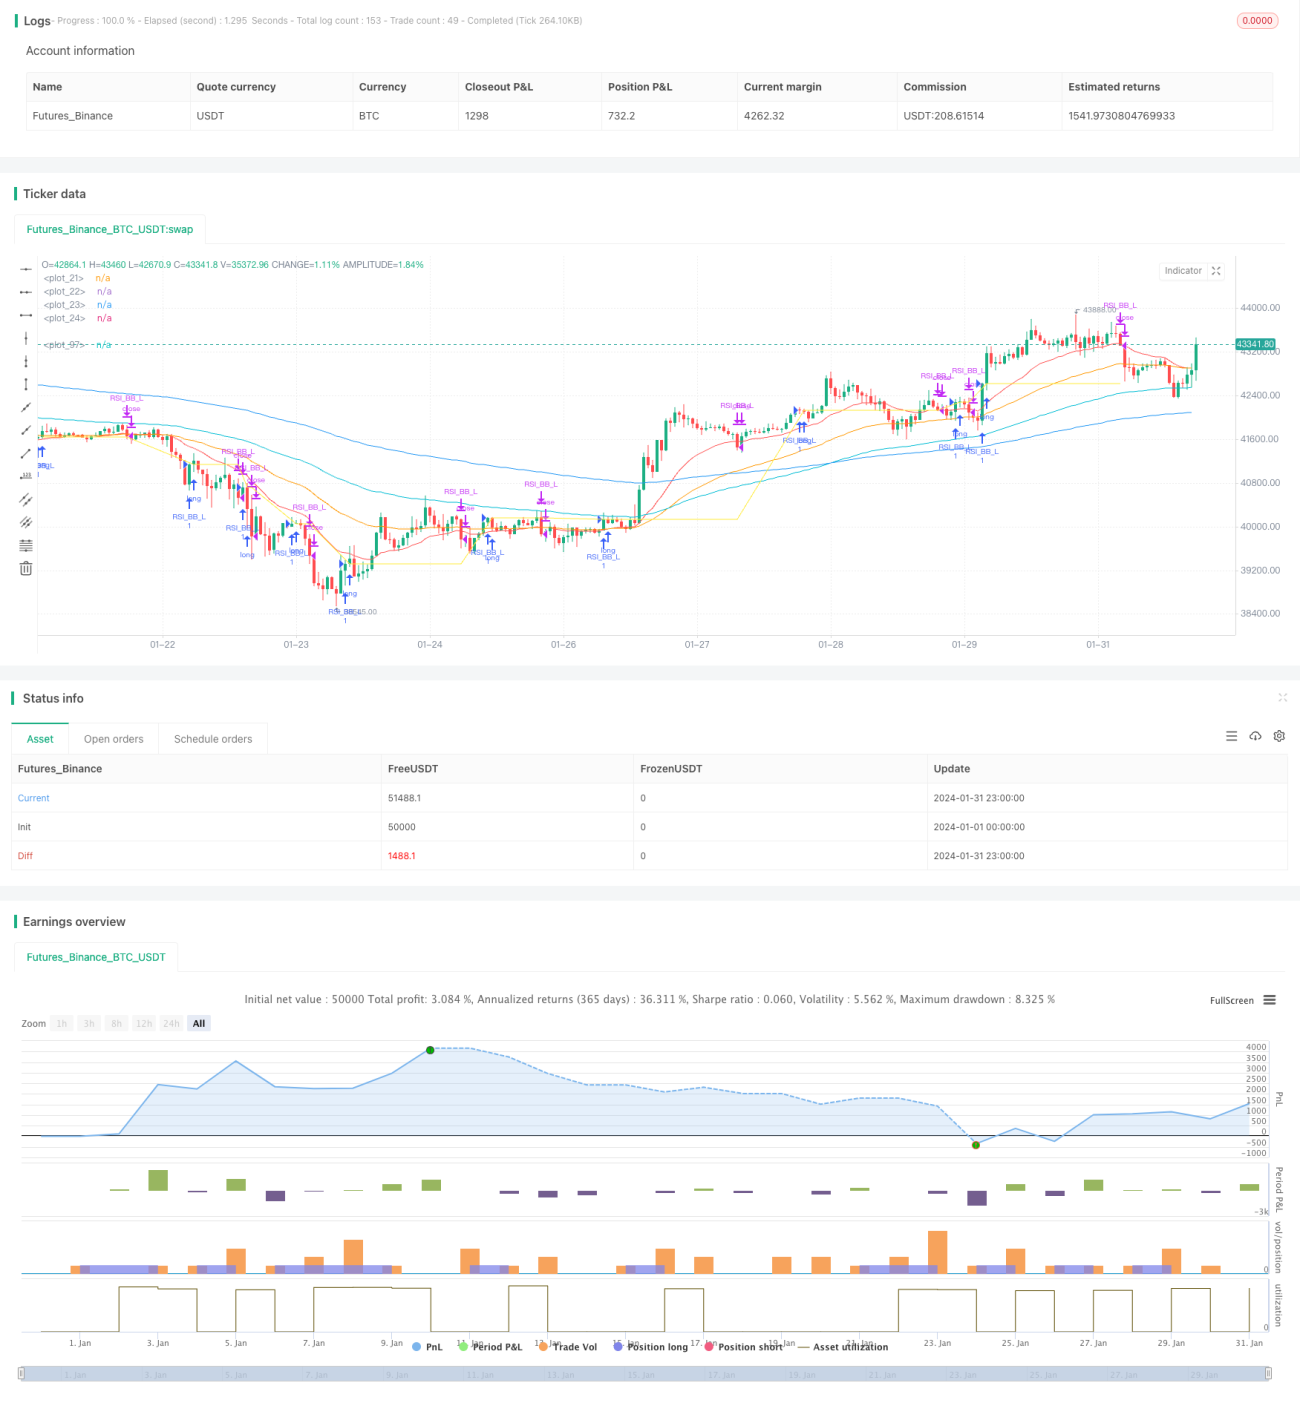
この戦略は,ブリン帯とMACDの指標に基づく量化取引戦略である.これは,ブリン帯の突破取引とMACDのトレンド追跡を融合し,取引信号の質を向上させることを目的としている.

戦略原則

この戦略は主にブリン帯指数とMACD指数による取引信号の判断に基づいています.

ブリン帯の指標は,中軌,上軌,下軌で構成されている.価格が下軌を突破すると買取シグナルが生成され,価格が上軌を突破すると売り出しシグナルが生成される.この戦略は,ブリン帯の突破原理を使用して,より強い突破シグナルを特定する.

MACD指数は,短期と長期の移動平均の関係を反映し,差値線とシグナル線の金叉,死叉によって買いと売りのタイミングを判断する.この戦略は,差値線がシグナルラインを突破するときにより効果的な買い信号を生成するために,マックド指数を使用して,ダブリン帯の取引信号をフィルターする.

全体として,この戦略はブリン帯のトレンド追跡とMACDの移動平均の優位性を組み合わせ,強烈なトレンドの中でより大きな市場変動を捕捉することを目的としています.

戦略的優位性

  1. ブリン帯とMACDの組み合わせにより,取引信号はより信頼性が高くなります.

  2. トレンド状況では,ブリン帯のトレンド追跡とMACD移動平均線の交差は,強力な入場信号を生成する.

  3. 双重指標判断により,偽信号を効率的にフィルターして取引リスクを低減する.

  4. 戦略パラメータの最適化スペースは広く,異なる品種と周期に応じて調整できます.

戦略リスク

  1. ブリン帯とMACDによって生成される取引シグナルは,揺れのある状況で頻繁に発生し,ブレーキリスクをもたらす可能性があります.

  2. MACD指数は,下位区域で3回の金叉買入シグナルが出現し,反転下落のリスクに直面する可能性がある.

  3. 戦略は指標を多く使用し,パラメータの最適化と戦略テストの難しさが大きい.

上記のリスクは,適切な保持時間の調整,ストップ・ローンの設定,最適化パラメータなどの方法によって制御できます.

戦略最適化の方向性

  1. テストはより長い周期のブリン帯のパラメータで,取引の頻度を下げます.

  2. MACD 速慢平均線パラメータを最適化して,指標の感度を向上させる.

  3. KDJ,RSIなどの他の指標のフィルターを追加して,信号の質を向上させる.

  4. ダイナミックストップと自動ストップ・アウトを設定し,単一取引のリスクを制御します.

要約する

この戦略はブリン帯突破取引とMACD指数フィルタリングを統合し,理論的には高品質の取引信号を生成する.パラメータ最適化とリスク管理手段により,より良い反測結果が得られる見込みがある.しかし,いかなる戦略も完全に損失を回避することはできません.実際の取引効果を慎重に評価する必要があります.

ストラテジーソースコード
/*backtest
start: 2024-01-01 00:00:00
end: 2024-01-31 23:59:59
period: 1h
basePeriod: 15m
exchanges: [{"eid":"Futures_Binance","currency":"BTC_USDT"}]
*/

//@version=5
strategy("Nabz-BBMACD-2022-V1.1", shorttitle="BBM-Nabz", overlay=true)


// My 1st Pine Scrpt Indicator
// Work on best on 1Hr Chart
// Open for Help/Donations.


var float lastentry=1
int result = 0
float x = 0
drawshape = false

/////////////EMA
shortest = ta.ema(close, 20)
short = ta.ema(close, 50)
longer = ta.ema(close, 100)
longest = ta.ema(close, 200)

plot(shortest, color = color.red)
plot(short, color = color.orange)
plot(longer, color = color.aqua)
plot(longest, color = color.blue)

///////////// RSI
RSIlength = input(6,title="RSI Period Length") 
RSIoverSold = 50
RSIoverBought = 50
price = close
vrsi = ta.rsi(price, RSIlength)


///////////// Bollinger Bands
BBlength = input.int(200, minval=1,title="Bollinger Period Length")
BBmult = 2 // input(2.0, minval=0.001, maxval=50,title="Bollinger Bands Standard Deviation")
BBbasis = ta.sma(price, BBlength)
BBdev = BBmult * ta.stdev(price, BBlength)
BBupper = BBbasis + BBdev
BBlower = BBbasis - BBdev
source = close
buyEntry = ta.crossover(source, BBlower)
sellEntry = ta.crossunder(source, BBupper)


////////////// MACD
fastLength = input(12)
slowlength = input(26)
MACDLength = input(9)
MACD = ta.ema(close, fastLength) - ta.ema(close, slowlength)
aMACD = ta.ema(MACD, MACDLength)
delta = MACD - aMACD


///////////// Colors
switch1=input(true, title="Enable Bar Color?")
switch2=input(true, title="Enable Background Color?")
TrendColor = RSIoverBought and (price[1] > BBupper and price < BBupper) and BBbasis < BBbasis[1] ? color.red : RSIoverSold and (price[1] < BBlower and price > BBlower) and BBbasis > BBbasis[1] ? color.green : na


///////////Strategy

bool tcu = not (ta.crossunder(price[0],shortest[0]))


if (((price[1]<BBlower[1]) and (ta.crossover(price,BBlower))))
    lastentry := low[1]
    strategy.entry("RSI_BB_L", strategy.long, comment="Buy 1st IF")
    
if (((ta.crossover(delta, 0.0) and (ta.crossover(price,BBlower)))))
    lastentry := low[1]
    strategy.entry("RSI_BB_L", strategy.long, comment="Buy 2nd IF")    
    
if (((ta.crossover(delta, 0.0)) and (low[0]>shortest[0])) and (price[1]<low))
    lastentry := low[1]
    strategy.entry("RSI_BB_L", strategy.long, comment="Buy 3rd IF")   //else

if (((ta.crossover(delta, 0.01)) and (high[1]<BBupper)) and (tcu))
    lastentry := low[1]
    strategy.entry("RSI_BB_L", strategy.long, comment="Buy 4th IF")

       
if ((ta.crossunder(low[0],shortest[0]) and close<shortest))
    strategy.close(id="RSI_BB_L", comment="Close by 1st IF")


if (price<lastentry)
    drawshape := true
    
if (price<strategy.opentrades.entry_price(0)/1.01175734321249)
    strategy.close(id="RSI_BB_L", comment="Close by 2nd IF")


plot(strategy.opentrades.entry_price(0), color=color.yellow)