ムーンフラッグ MACD モメンタム StochRSI 取引戦略

概要
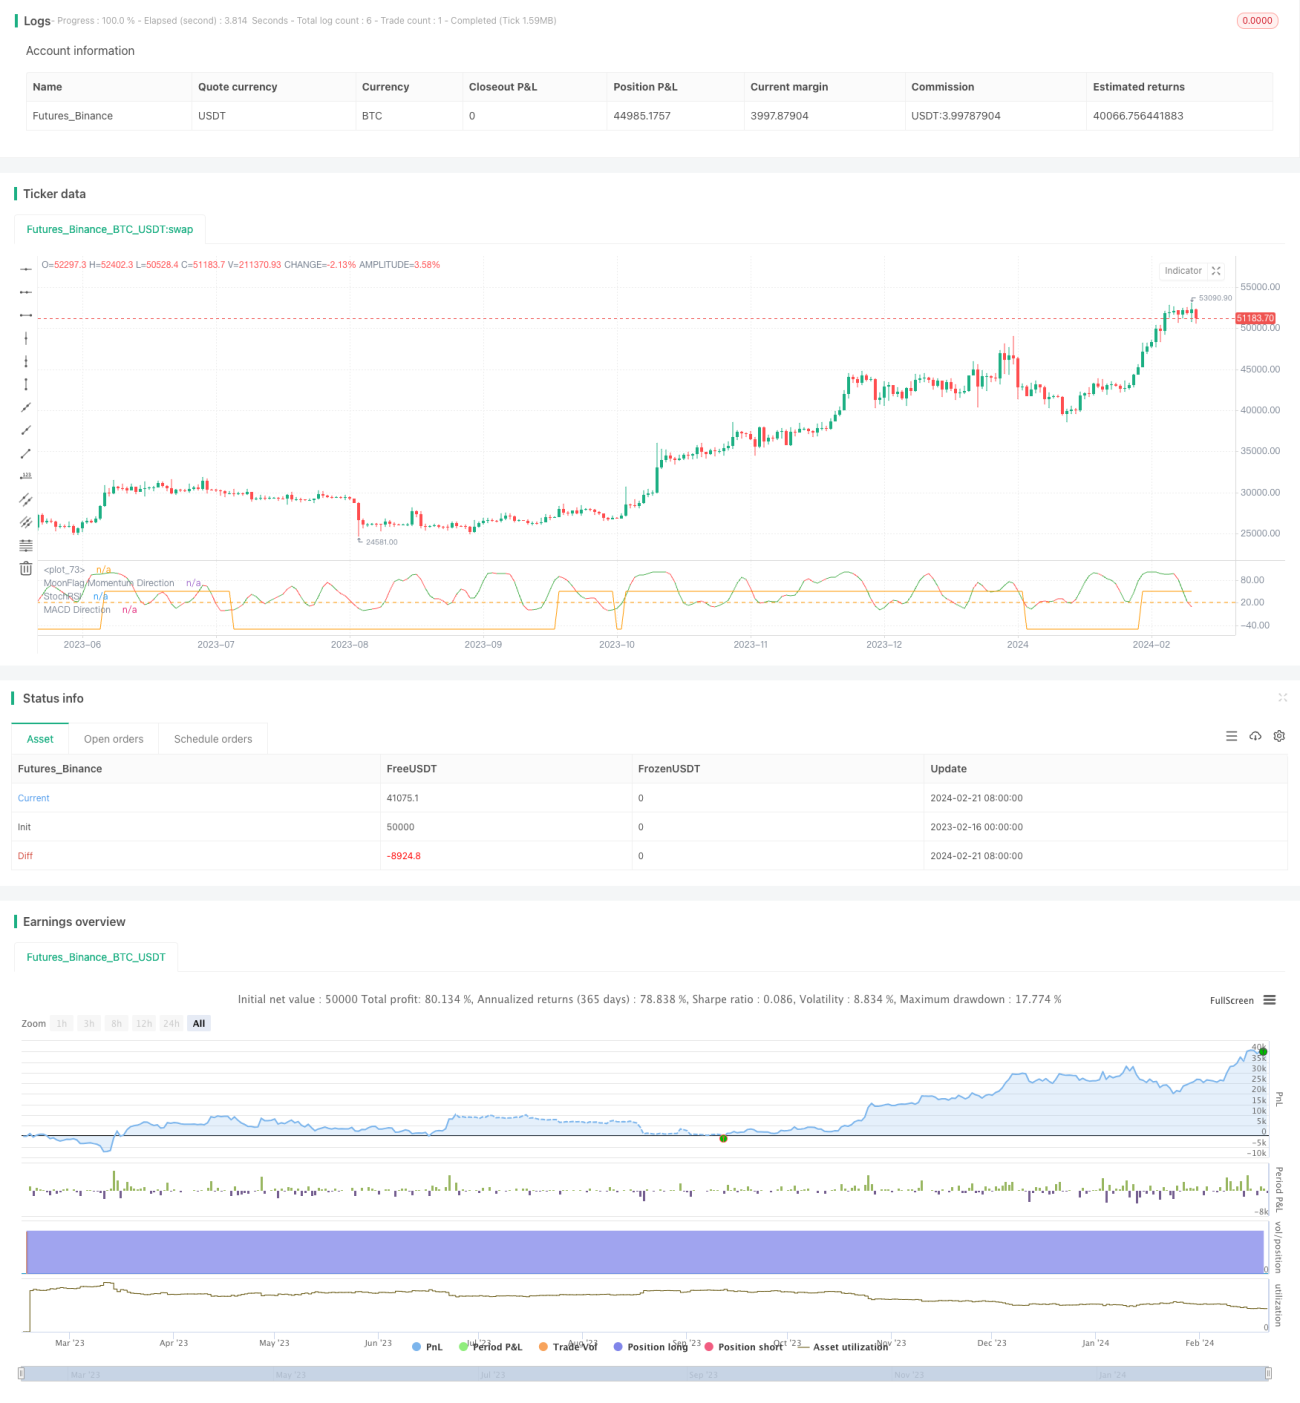
月旗MACD動力StochRSI取引戦略は,MACD,動力およびStochRSIの3つの指標を使用して判断する量的な取引戦略である.この戦略は,主にビットコインとイーサリアムの日線取引に適用される.
戦略原則
この戦略は,以下の主要な指標を用いて判断します.
-
MACD指数:急速SMA周期は50で,遅いSMA周期は200で,市場でよく使われる50日線と200日線を代表する.この指数は,市場の長期トレンド方向を判断する.
-
自作動量指標:本質的にストック指標に類似し,市場の短期的な動力の方向を判断するために使用される.
-
ストックRSI指標:市場の強さと過剰買いと過剰売れを判断する
多頭に入るときは,同時にMACD>0 (中長期の上昇傾向を表す),自創動量指標>0 (短期の上昇傾向を表す) と,閉盤前日の値上げ (現在の上昇傾向を表す) の3つの条件を満たす必要があります.
平面多頭シグナルは,MACD<0,自創量指数<0,閉盘価格が前日より下落し,StochRSI>20の4つの条件を同時に満たす必要がある.
この戦略は,中長期の傾向,短期的な動向,そして現在の傾向を総合的に判断し,より堅牢な突破システムである.
戦略的優位性
-
複数の指標を統合して判断し,偽信号を避ける
-
MACDパラメータは,市場にとって重要な50日線と200日線を考慮して選択された.
-
各指標のパラメータのテスト変更後,戦略効果はほとんど変化せず,過適合のリスクを回避
-
観測データは十分で信頼性が高い.
戦略リスク
-
破綻したシステムは利回りしやすいため,取引回数やスライドポイントのコストが増加する可能性があります.
-
総合的な多指標判断の複雑さ,パラメータの調整と最適化の難しさ
-
日中のショートラインの操作はリスクが高い.
戦略の最適化
-
取引量分析など,他の指標と組み合わせる
-
機械学習アルゴリズムを追加し,動態パラメータ最適化を実現する.
-
取引頻度を下げ,より高い周期に切り替える
要約する
月旗MACD動力StochRSI取引戦略は,市場の傾向と強さを判断する複数の指標を統合し,反測効果が良好で,信頼性が高く,経験豊富な量化トレーダーが高品質のデジタル通貨で適用および最適化するのに適しています.
/*backtest
start: 2023-02-16 00:00:00
end: 2024-02-22 00:00:00
period: 1d
basePeriod: 1h
exchanges: [{"eid":"Futures_Binance","currency":"BTC_USDT"}]
*/

// // This Pine Script™ code is subject to the terms of the Mozilla Public License 2.0 at https://mozilla.org/MPL/2.0/
// // © MoonFlag
//@version=5
strategy("MoonFlag 1D MACD Momentum StochRSI Strategy", max_bars_back=500, overlay=false, initial_capital=5000, default_qty_type=strategy.percent_of_equity, default_qty_value=80, pyramiding=0, calc_on_order_fills=true)- 1