モメンタム指標に基づく短期取引戦略

概要
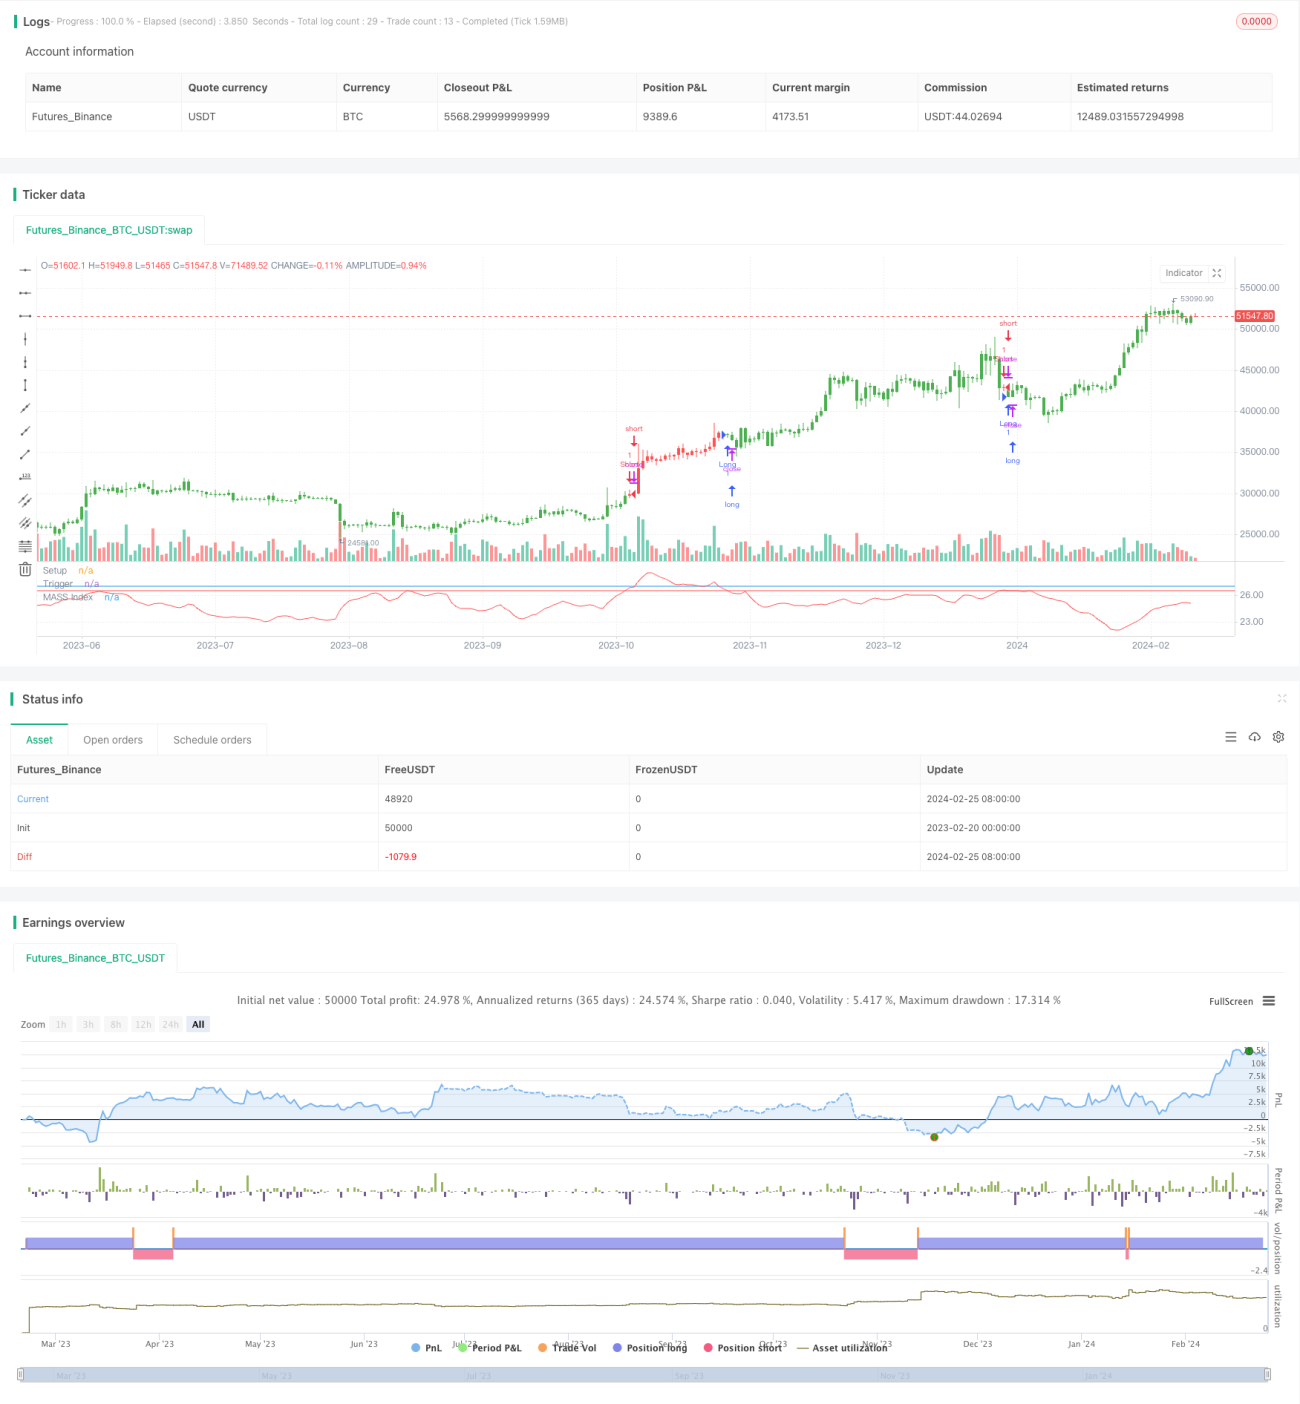
この戦略は,動態指数に基づく短期取引戦略である.動態指数であるマスインデックスを利用して,市場動向の転換点を認識し,短期取引機会を捉える.
戦略原則
この策略は,2つの異なるパラメータの指数移動平均EMAを使用して,価格の最高値と最低値の差を平坦化して,指標であるMass Indexを得る.Mass Index上の特定の<unk>値を通過すると空き;Mass Indexの下の特定の<unk>値を通過すると多めにする.
具体的には,まずは最高値と最低値の差 xPrice を計算する。それからxPrice の9周期と25周期のEMA を計算し,それぞれxEMAとxSmoothXAvg と命名する。次に,この2つのEMA の比値の和を計算して,Mass Index を得る。Mass Index がある<unk>値より大きい時は空し,ある<unk>値より小さい時は多する。
この戦略は,マス・インデックスの上下突破を利用してトレンドの転換点を判断し,短期取引を行う.市場の揺れが強くなるとマス・インデックスは上昇し,市場の揺れが弱くなるとマス・インデックスは低下する.その突破のレベルを監視することで,短期取引の機会を効果的に捉えることができる.
戦略的優位性
この戦略の利点は以下の通りです.
- マスインデックスの動態指標を使用し,短期間の変動とトレンド転換を効果的に識別できます.
- 買い物や売却のタイミングを正確に決め,上昇や下落を追いかけるのを避ける
- 取引戦略とパラメータはシンプルでわかりやすく実行できます.
- 柔軟に調整可能なパラメータ,異なる市場環境に適用
戦略的リスクと解決策
この戦略にはいくつかのリスクがあります.
- 偽の突破が起こり,不必要な取引が起こる可能性があります. 誤報率を減らすためにパラメータを適切に調整できます.
- 長期トレンド判断を考慮しないことにより,主トレンドから逸脱することがあります.トレンド指標を組み合わせて反トレンド操作を避けることができます.
- データの曲線適合リスク。サンプル範囲を適切に拡張し,パラメータの安定性を検査する。
戦略最適化の方向性
この戦略は以下の点で最適化できます.
- 株式の基本面分析と組み合わせた低品質の株式の過剰な波動を避ける
- 損失防止機構を増やし,単一損失を厳しく管理する
- 波動性指数と組み合わせて,市場の揺れが激化する時にポジションの規模を縮小する
- 条件単一機能を追加し,出場時間を最適化
要約する
この戦略は,マス・インデックス指数に基づいて,より簡素な短期取引戦略を設計し,市場の転換点を効果的に識別して,正確に空白を多く行うことができます.この戦略の取引戦略とパラメータの設定は,シンプルで直感的で,容易に実施され,異なる市場環境に応じて調整して最適化され,強力な実用性があります.しかし,データ過適合と指標の失敗のリスクにも注意し,トレンド判断と損失対策を組み合わせて,市場の不確実性に対応する必要があります.
/*backtest
start: 2023-02-20 00:00:00
end: 2024-02-26 00:00:00
period: 1d
basePeriod: 1h
exchanges: [{"eid":"Futures_Binance","currency":"BTC_USDT"}]
*/

//@version=2
////////////////////////////////////////////////////////////
//  Copyright by HPotter v1.0 12/09/2017
// The Mass Index was designed to identify trend reversals by measuring - 1