サポートとレジスタンスのトレンドフォロー戦略

1
Follow
1782
Followers
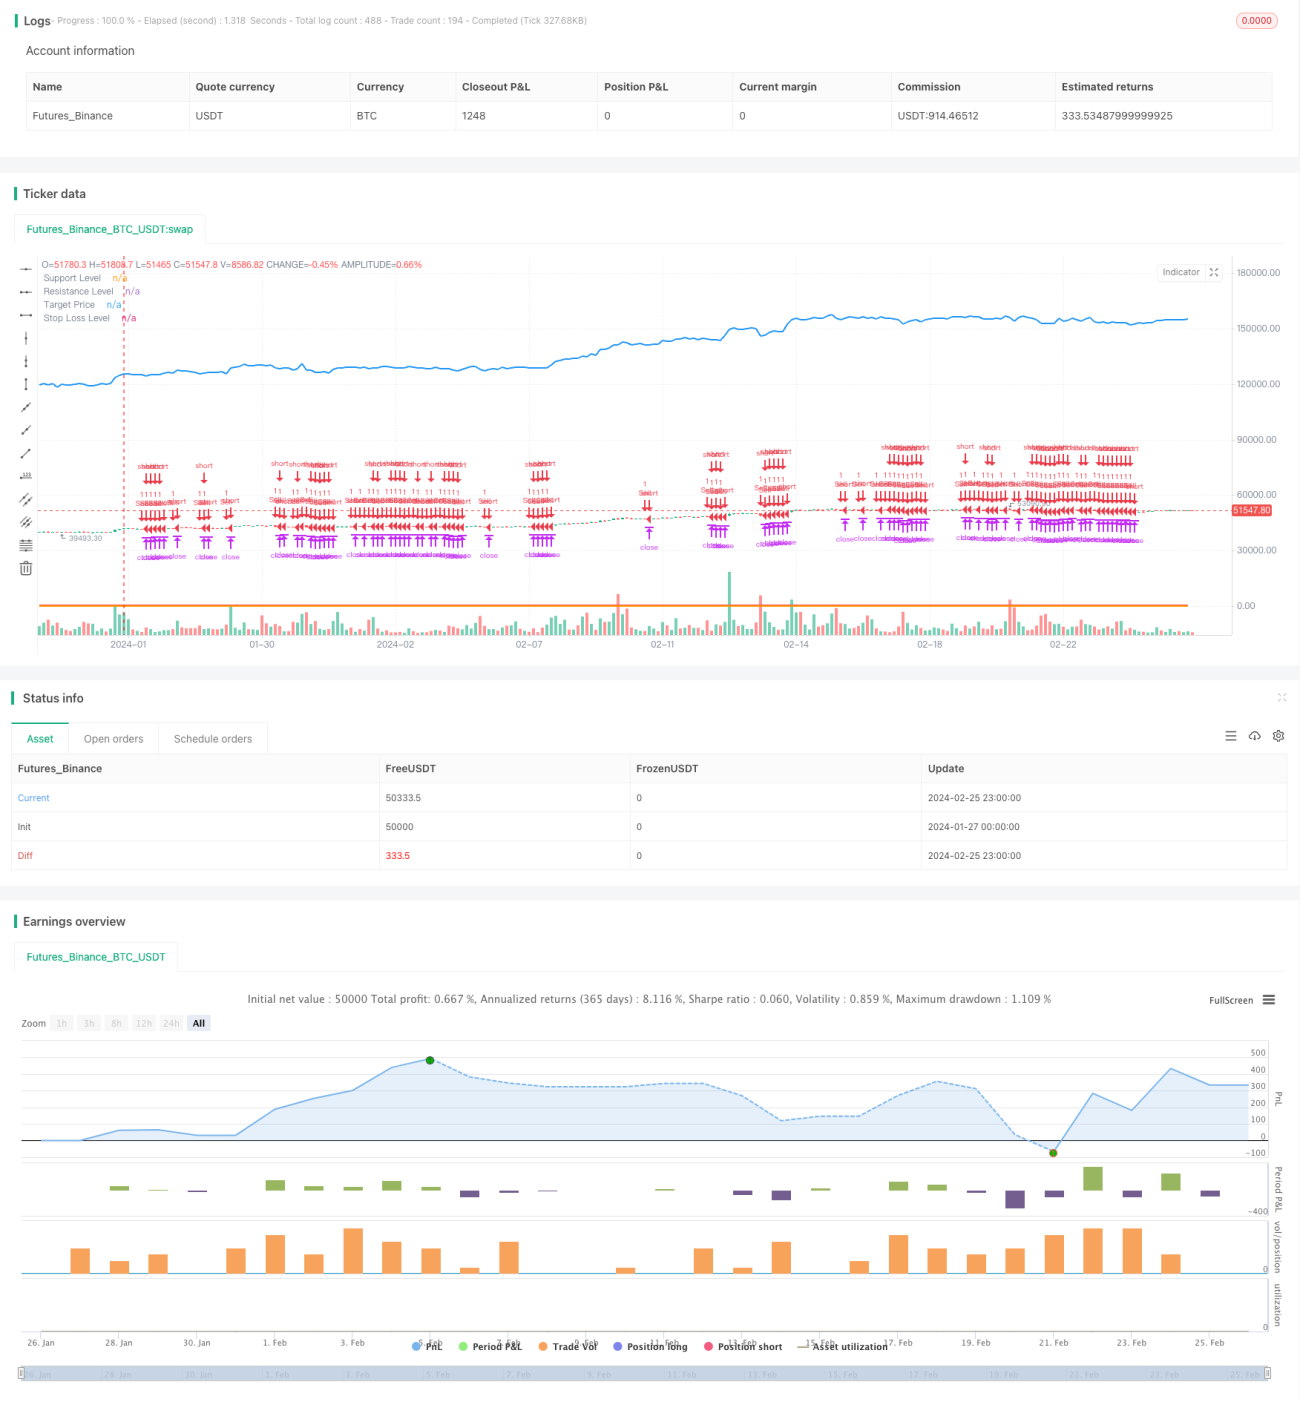
概要
この戦略は,サポート,レジスタンス,トレンドラインの3つの技術指標を活用して,自動的に入場と止まりをします.戦略は,まず,重要なサポートとレジスタンス点を識別し,次にトレンドの方向と組み合わせて入場のタイミングを判断します.
戦略原則
- 重要なサポートとレジスタンス点を識別する.
- トレンドラインを使って市場のトレンド方向を判断する.昨日の閉盤価格より価格が高くなった場合,上昇傾向として定義され,そうでなければ下降傾向として定義される.
- 価格がサポートレベルに近づき,上昇傾向にあるときに,買入シグナルを発する.
- 価格がレジスタンスレベルに近づいて下落傾向にあるとき,セールシグナルを発信する.
- ストップ目標 リスク・リターン比率に基づいて計算され,ストップ・ロスはサポート位の近くに設定されます.
- ローキングストップを選択して利益をロックします.
優位分析
- サポート,レジスタンス,トレンドの3つの強力な指標の利点を最大限に活用してください.
- 自動で判断して,主観的な間違いを避ける.
- リスクはコントロール可能で,ストップ・ロスはキー・サポートの近くで制御されます.
- ストップ・ロスを選択して利益を固定し,利益の転移を回避します.
リスク分析
- 破綻のリスク. 価格がサポートまたはレジスタンス値を破ると,再び戻り,<unk>化を引き起こす可能性があります.
- トレンド判断の失敗リスク。 トレンドラインを使ってトレンド判断の方向は誤りがあるかもしれない。
- ストップダメージが破られるリスク。 ストップダメージは支柱から遠くないが,激しい波動では直接突破される可能性がある。
どう対処するか?
- 適正に緩解したサポート抵抗の判定幅.
- 複数の指標を用いてトレンドを検証する.
- 障害の範囲を停止するか,時間通りに人工介入するか.
最適化の方向
- さらに多くの指標の認証入場信号を追加し,正確性を向上させる.例えば,量値指標,移動平均など.
- サポートレジスタンス位とストップダメージ位の設定を最適化します. 異なるパラメータが結果に与える影響をテストできます.
- マシン・ラーニングでパラメータを自動的に最適化してみましょう.
要約する
この戦略は,複数の技術指標の優位性を統合し,合理的なパラメータ設定の前提で,よりよいリターンリスク比を得ることができる.パラメータ設定と入場順序の最適化が鍵である.全体的に,この戦略の枠組みは合理的で,大きな改善の余地がある.
Source
Pine
Strategy parameters
Related strategies
Comment
All comments (0)
No data
- 1