
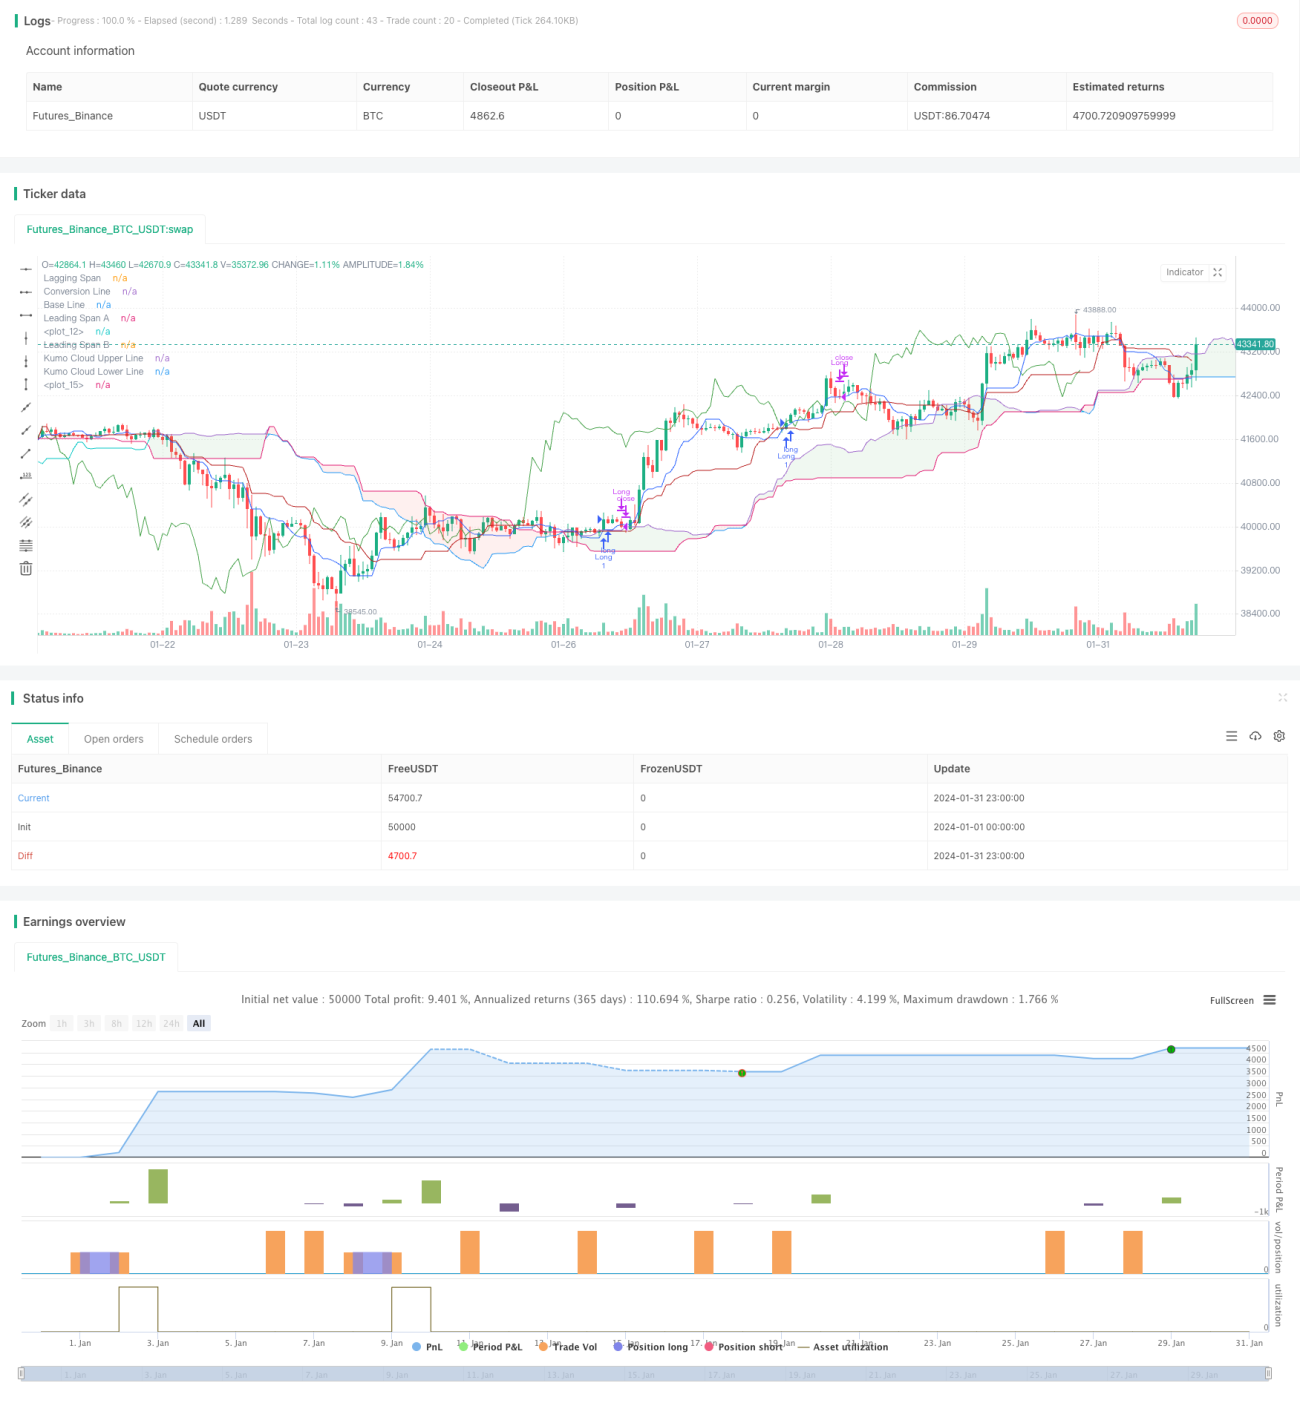
一目平衡図のトレンドフォロー戦略 (Ichimoku Cloud Trend Following Strategy) は,技術分析戦略である.一目平衡図の5つの指標線を使用して,市場のトレンド方向を判断し,抵抗点をサポートし,入場タイミングを決める.
戦略の核心的な指標は以下の通りです.
変換線上での基準線を横切るときは買い信号;下穿は売り信号である.動線は価格の上にあり,雲団の色は緑色で多頭トレンドである,そうでなければ空頭である.
策略は,変換線と基準線の関係によってトレンドの方向を判断する.例えば,変換線が基準線を向上して突破すると,多頭入場として判断され,このとき,随動線が価格より高い条件を満たす場合,買取信号が生じます.
ストップまたはストップは先行線Aまたは基準線に基づいて設定する.基準線ストップを選択した場合,価格が基準線を下回ったときに平仓する.
この戦略の利点は以下の通りです.
この戦略の主なリスクは,誤った信号を発生させる可能性である.
一目平衡図戦略は,市場動向を判断する多指標を統合し,短期的な動力を考慮するとともに,中長期のトレンドにも重点を置きます. 変換線とベースラインの関係が,市場の買い売りのタイミングを判断し,ベースラインは,ストップ・ローズ線として利益をロックし,リスクを効果的に制御します. この戦略は,中長期のトレンドを追跡する取引に適しています.
/*backtest
start: 2024-01-01 00:00:00
end: 2024-01-31 23:59:59
period: 1h
basePeriod: 15m
exchanges: [{"eid":"Futures_Binance","currency":"BTC_USDT"}]
*/
//@version=5
strategy(title="Ichimoku Cloud - BitBell", shorttitle="Ichimoku Cloud - BitBell", overlay=true)
conversionPeriods = input.int(9, minval=1, title="Conversion Line Length")
basePeriods = input.int(26, minval=1, title="Base Line Length")
laggingSpan2Periods = input.int(52, minval=1, title="Leading Span B Length")
displacement = input.int(26, minval=1, title="Lagging Span")
donchian(len) => math.avg(ta.lowest(len), ta.highest(len))
conversionLine = donchian(conversionPeriods)
baseLine = donchian(basePeriods)
leadLine1 = math.avg(conversionLine, baseLine)
leadLine1bbbbb = math.avg(conversionLine, baseLine)[displacement - 1]
plot(leadLine1bbbbb)
leadLine2 = donchian(laggingSpan2Periods)
leadLine2bbbbbb = donchian(laggingSpan2Periods)[displacement - 1]
plot(leadLine2bbbbbb)
support = leadLine1bbbbb > leadLine2bbbbbb
Resistance = leadLine1bbbbb < leadLine2bbbbbb
TrailStop = input.string(title='Choose Trail Line', options=["ConversionLine", "BaseLine"], defval="ConversionLine")
var stopLong = 0.0
var stopShort = 0.0
var TagetLong = 0.0
var TargetShort = 0.0
if close > leadLine1bbbbb and close > leadLine2bbbbbb and conversionLine[1] <= baseLine[1] and conversionLine > baseLine and close > conversionLine and support
strategy.entry("Long",strategy.long)
stopLong := conversionLine
// if close < stopLong and strategy.position_size > 0
// strategy.close("Long")
// stopLong := 0.0
if (close < conversionLine and strategy.position_size > 0) and (TrailStop == 'ConversionLine')
strategy.close("Long")
stopLong := 0.0
if (close < baseLine and strategy.position_size > 0) and (TrailStop == 'BaseLine')
strategy.close("Long")
stopLong := 0.0
if close < leadLine1bbbbb and close < leadLine2bbbbbb and conversionLine[1] >= baseLine[1] and conversionLine < baseLine and close < conversionLine and Resistance
strategy.entry("Short",strategy.short)
stopShort := conversionLine
// if close > stopShort and strategy.position_size < 0
// strategy.close("Short")
// stopShort := 0.0
if (close > conversionLine and strategy.position_size < 0) and (TrailStop == 'ConversionLine')
strategy.close("Short")
stopShort := 0.0
if (close > baseLine and strategy.position_size < 0) and (TrailStop == 'BaseLine')
strategy.close("Short")
stopShort := 0.0
// if close >= 1.0006 * strategy.position_avg_price and strategy.position_size > 0
// strategy.close("Long")
// stopLong := 0.0
plot(conversionLine, color=#2962FF, title="Conversion Line")
plot(baseLine, color=#B71C1C, title="Base Line")
plot(close, offset = -displacement + 1, color=#43A047, title="Lagging Span")
p1 = plot(leadLine1, offset = displacement - 1, color=#A5D6A7,
title="Leading Span A")
p2 = plot(leadLine2, offset = displacement - 1, color=#EF9A9A,
title="Leading Span B")
plot(leadLine1 > leadLine2 ? leadLine1 : leadLine2, offset = displacement - 1, title = "Kumo Cloud Upper Line", display = display.none)
plot(leadLine1 < leadLine2 ? leadLine1 : leadLine2, offset = displacement - 1, title = "Kumo Cloud Lower Line", display = display.none)
fill(p1, p2, color = leadLine1 > leadLine2 ? color.rgb(67, 160, 71, 90) : color.rgb(244, 67, 54, 90))