ナットオフライントレンドフォロー戦略
この記事では,200日移動平均と価格の距離に基づくトレンド追跡型の策略を詳細に分析する.この策略は,価格と200日移動平均の距離を追跡し,設定された値を超えた時にポジションを確立し,利益の目標に達した後に平仓を離れる.
戦略の原則
この戦略の核心指標は,200日指数移動平均 ((200 EMA)) である.この戦略は,価格が200日線から偏っているかどうかを設定されたパーセントに達した後に判断し,最近の一つのK線が陽線 ((多頭入場) または陰線 ((空頭入場) であるときの部位を確立する.多頭入場条件は,価格が200日線を下回り,価格と200日線との距離が百分比値より大きく,最近の一つのK線が收益陽線時に入場する.空頭入場条件は,価格が200日線と200日線との距離が百分比値より大きく,そして最近の一つのK線が收益陰線時に入場する.
退出条件は,価格が200日線に戻ったとき,またはストップポイント目標 (入場価格の1.5倍) に到達したときに平仓退出である. ストップをオプションの申告価値の20%に設定する.
詳細は以下の通りです.
複数の入学者:閉じる値<200日線 閉じる値と200日線との距離の比率≥値 閉じる値と200日線との距離の比率≥値 閉じる値と200日線との距離の比率
裸足の入場:閉じる値>200日線 閉じる値と200日線との距離の比率≥値 閉じる線はK線に近かった
複数の出演者:閉店価格≥200日線またはストップ目標または取引日の終了
空頭での出場:閉店価格<=200日線またはストップ目標または取引日の終了
オプションの申告価値の20%を停止条件とする.
2 戦略的優位性
この戦略の利点は以下の通りです.
- 200日移動平均を用いて,価格の中間の長線トレンドの方向を判断し,短期市場の騒音から遠ざかります.
- トレンドトラッキングの仕組みを確立し,中中長線価格トレンドを追跡する.
- 最新のK線方向が大きなトレンドと一致するときに入場を最適化します
- 合理的なストップ・アンド・ストップ・メカニズムにより,損失の拡大を防ぐ
3 戦略的リスク
この戦略には以下のリスクがあります.
- 大波期の価格が移動平均に何度も触れて,何度も損失を招く可能性
- トレンドの突然の逆転が,損失を抑えた退出を引き起こした.
- 設定したパラメータ,例えば移動平均周期の選択が不適切で,トレンドを正確に判断できない
上記のリスクを減らすために,以下の要素を最適化できます.
- 移動平均のパラメータを調整したり,他の指標を加えたりして大きなトレンドを判断します.
- 価格の変化に合わせてストップ距離を調整するなど,ストップメカニズムを最適化
- 入学条件を最適化し,判断基準を追加する
4 戦略の最適化方向
この戦略は以下の点で最適化できます.
- 移動平均のパラメータを最適化し,異なる周期パラメータが戦略の効果に与える影響をテストする
- ブリン・ライン・チャネル,KDJ指数など,他の指標を追加して,大きなトレンドを判断します.
- 市場状況の変化に合わせてストップレベルを動的に調整できるようにストップ戦略を調整する
- 短期調整による誤入学を回避するために入学条件を最適化
5つ目 結論
この記事では,価格と200日移動平均線の距離に基づくトレンド追跡戦略の原理,利点,リスクおよび最適化方向を詳細に分析する.この戦略は,価格と長期平均線の距離を追跡することによって中長期トレンド方向を判断し,価格が平均線を超える一定値に達したときにポジションを立て,ストップ・ローズまたはストップ・ストップを触発する.この戦略は,中長期価格のトレンドをよく追跡できるが,一定のパラメータの最適化スペースもある.将来,この戦略をさまざまな面で改善し続けることができ,さまざまな状況下でより安定した利益を得ることができる.
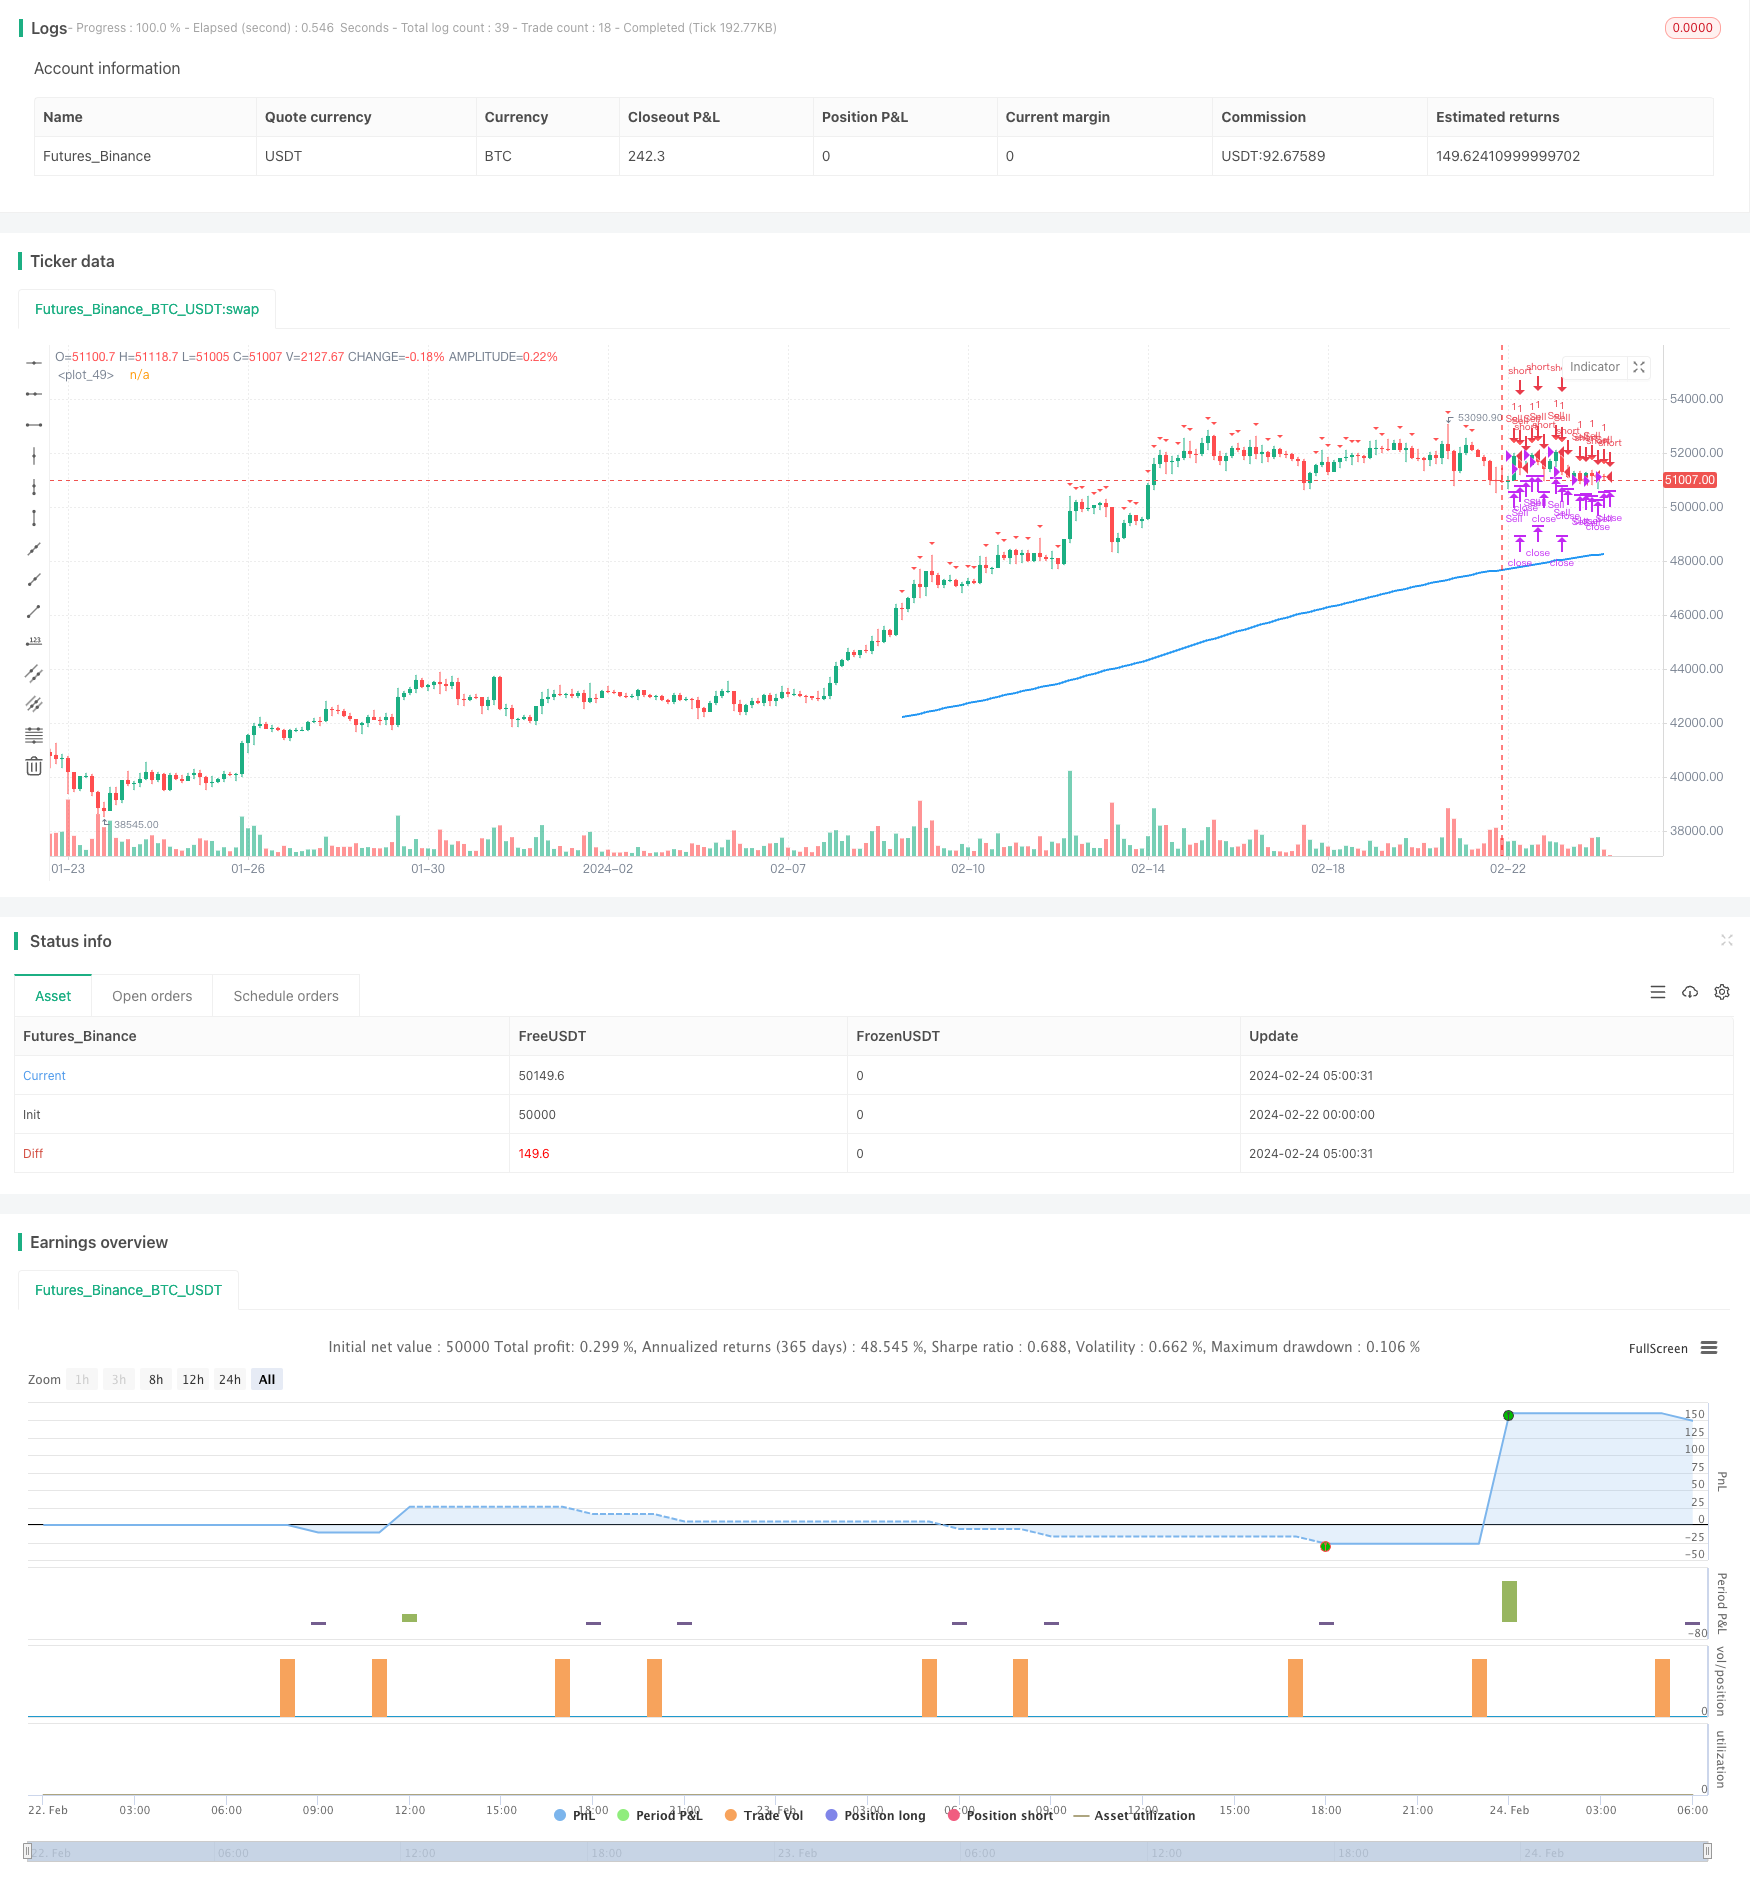
/*backtest
start: 2024-02-22 00:00:00
end: 2024-02-24 06:00:00
period: 3h
basePeriod: 15m
exchanges: [{"eid":"Futures_Binance","currency":"BTC_USDT"}]
*/

//@version=4
strategy("Intraday Price Away from 200 EMA Strategy", overlay=true)

// Define inputs
emaPeriod = input(200, title="EMA Period")
thresholdPercent = input(0.75, title="Threshold Percent", minval=0)  // Define the threshold percentage

// Calculate 200 EMA
ema = ema(close, emaPeriod)

// Calculate distance from 200 EMA as a percentage
distance_percent = ((close - ema) / ema) * 100

// Track average entry price
var float avgEntryPrice = na

// Buy conditions
buy_condition = close < ema and abs(distance_percent) >= thresholdPercent and close[1] < close[2]

// Exit conditions for buy
exit_buy_condition = close >= ema or time_close(timeframe.period) or (avgEntryPrice * 1.5) <= close

// Sell conditions
sell_condition = close > ema and abs(distance_percent) >= thresholdPercent and close[1] > close[2]

// Exit conditions for sell
exit_sell_condition = close <= ema or time_close(timeframe.period) or (avgEntryPrice * 1.5) >= close

// Execute buy and sell orders only if there are no open trades
if strategy.opentrades == 0
    strategy.entry("Buy", strategy.long, when=buy_condition)
    strategy.entry("Sell", strategy.short, when=sell_condition)

// Update average entry price for buy condition
if buy_condition
    avgEntryPrice := close

// Update average entry price for sell condition
if sell_condition
    avgEntryPrice := close

// Close buy position if exit condition is met
strategy.close("Buy", when=exit_buy_condition)

// Close sell position if exit condition is met
strategy.close("Sell", when=exit_sell_condition)

// Plot 200 EMA
plot(ema, color=color.blue, linewidth=2)

// Plot buy and sell signals
plotshape(buy_condition, style=shape.triangleup, location=location.belowbar, color=color.green, size=size.small)
plotshape(sell_condition, style=shape.triangledown, location=location.abovebar, color=color.red, size=size.small)