複数のEMAとRSIに基づくトレンドフォロー戦略
作成日:
2024-03-01 13:26:24
最終変更日:
2024-03-01 13:26:24
コピー:
14
クリック数:
922
1
フォロー
1750
フォロワー
概要
この記事では,主にRavikant_sharmaが開発した複数の指数移動平均 ((EMA) と相対的に強い指数 ((RSI) に基づく定量取引戦略を分析しています.この戦略は,EMAの異なる周期の交差とRSIの数値判断,価格トレンドを識別し,入場と出場のタイミングを決定します.
戦略原則
指標計算
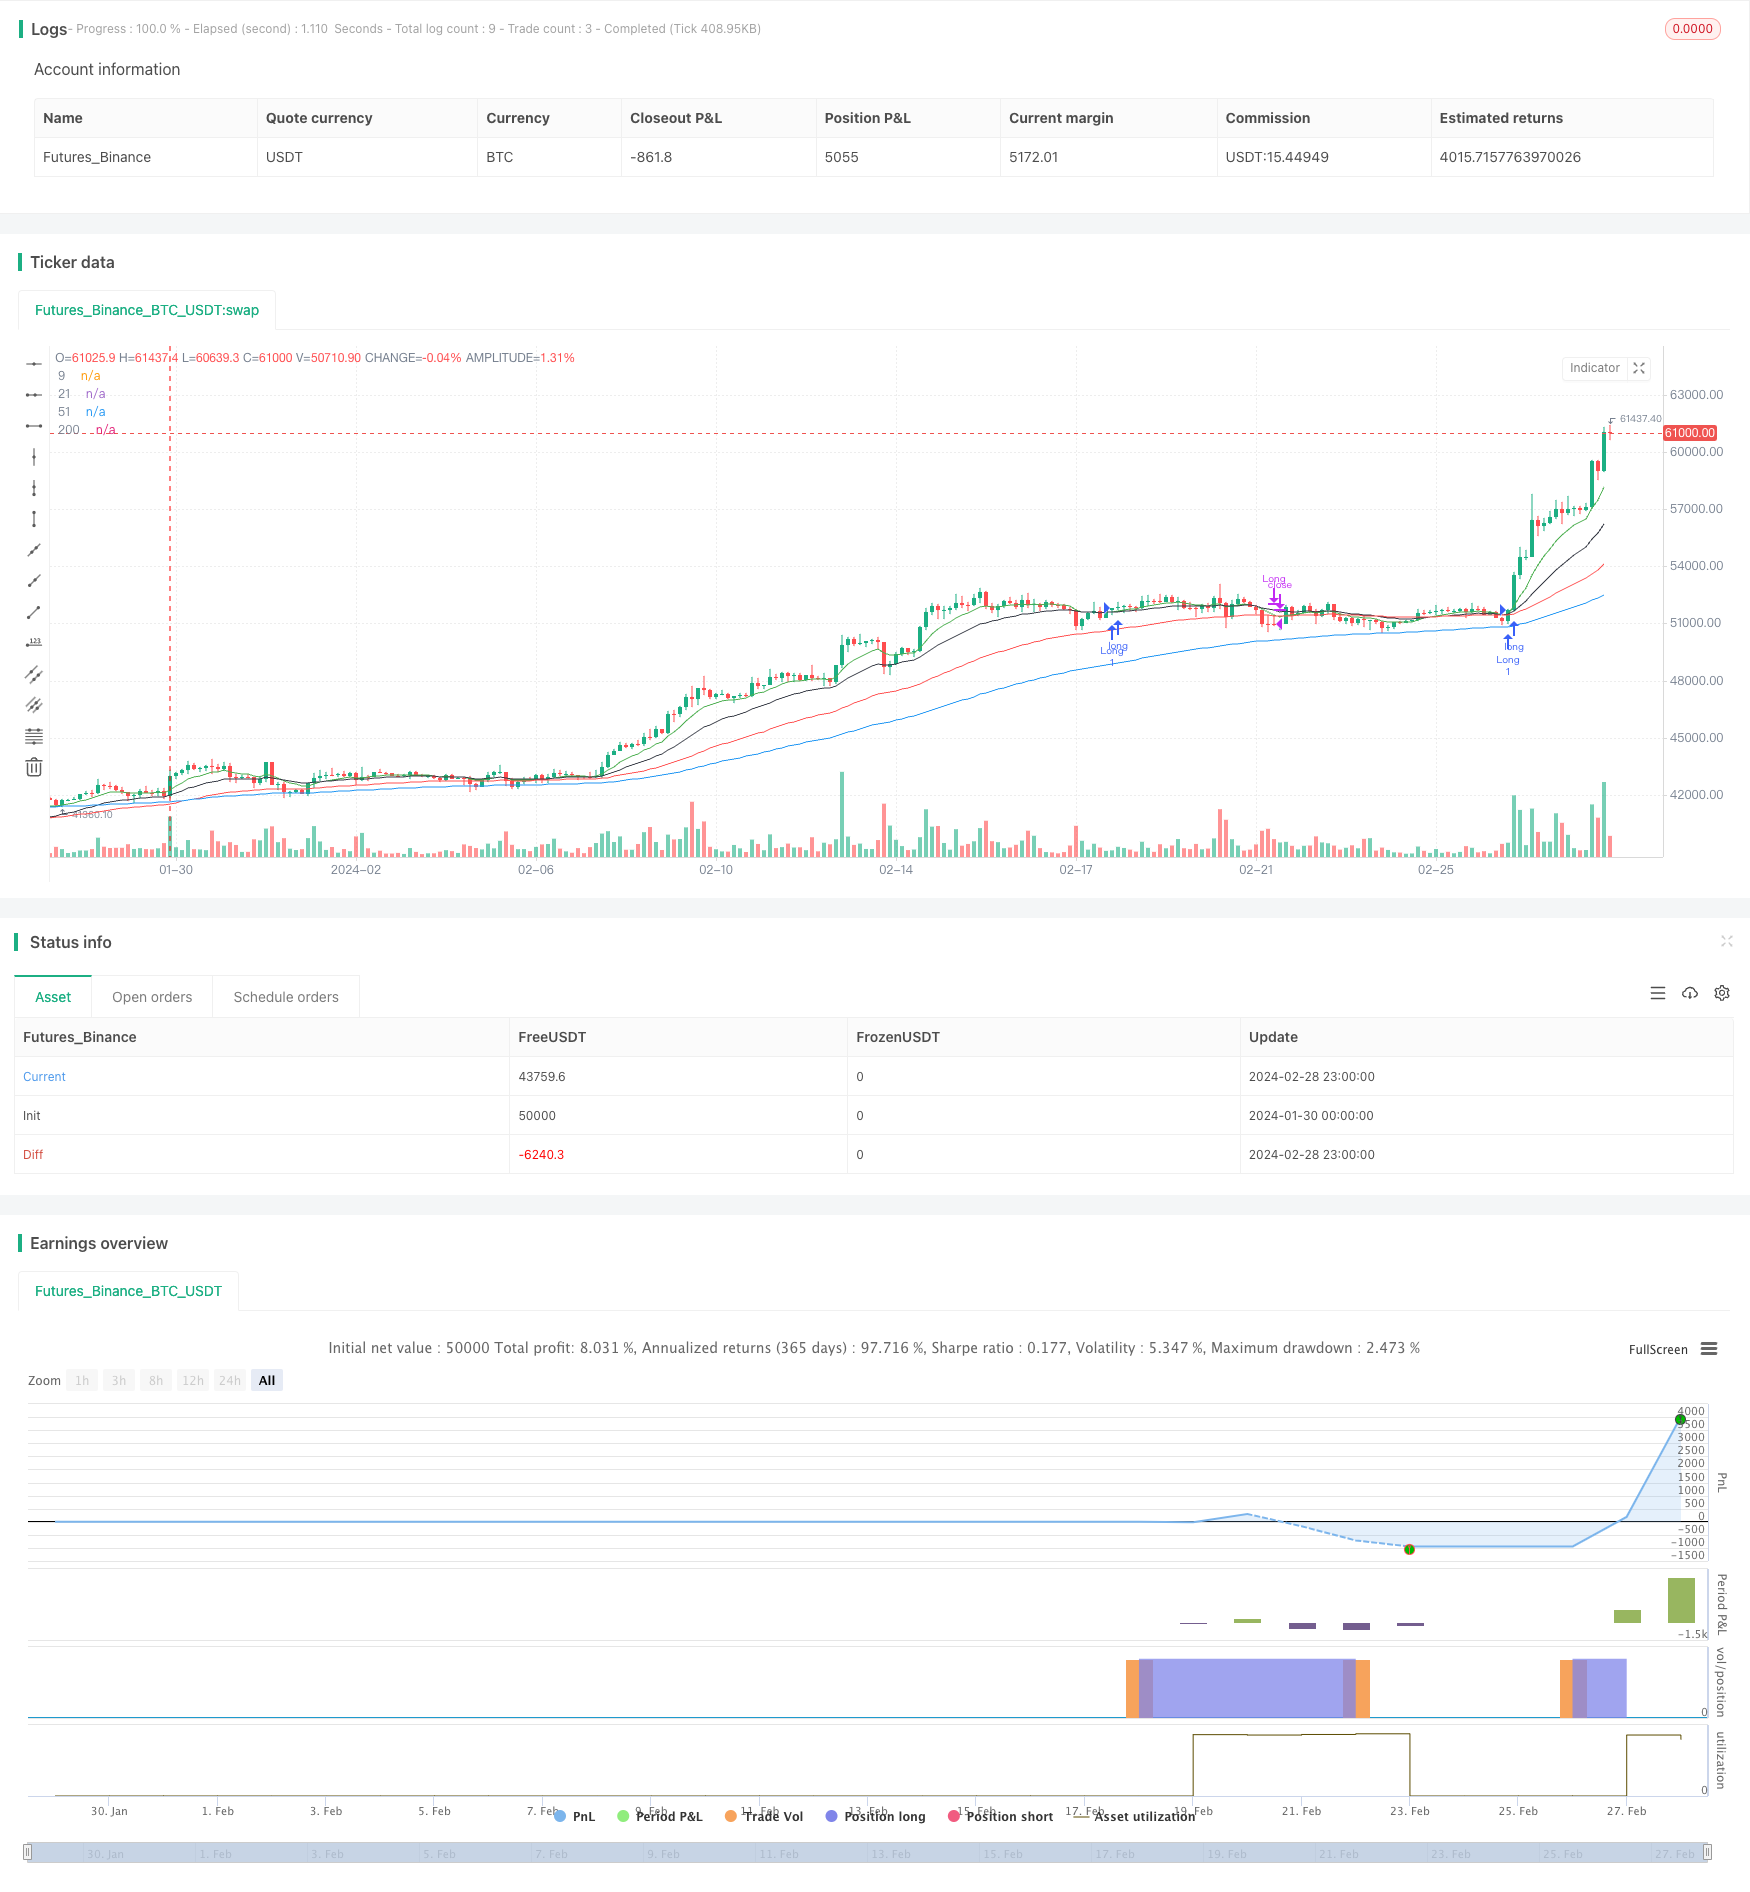
策略は,9日線,21日線,51日線,100日線,200日線を含む5つの異なる周期のEMAを使用します. コードでは最初の4つのEMAのみが描かれています. RSIパラメータは14に設定されています.
入学条件
ストラテジックは,以下のいずれかの条件を満たす場合,多額のポジションを開きます.
- 9日のEMAに21日のEMAを装う
- 9日EMA上着51日EMA
- 51日EMA以下で100日EMAを履いた
RSIが65を超えれば,強烈な上昇傾向を示します.
出場条件
策略平仓退出は,以下のいずれかの条件を満たす場合です.
- 9日のEMAは51日のEMAを下回り,トレンドの逆転を示している.
- 入場価格の125%を超える閉店価格で,利益目標を達成
- RSI値が40を下回ると,反転の信号が表示される
- 閉店価格は入場価格より98%低く,止損
優位分析
これは典型的なトレンド追跡戦略で,以下の利点があります.
- EMAを交差してトレンドの方向を判断し,価格トレンドを効果的に追跡する
- 周期的なEMAを組み合わせることで,より信頼できるトレンド信号を識別できます.
- RSIフィルターは,振動状況で誤信号を回避する
- ストップ・ストップ・ロスの位置を設定し,利潤をロックし,リスクを制御します.
リスクと解決策の分析
この戦略にはいくつかのリスクがあります.
- 揺れ動いている状況で不確実性のシグナルが繰り返し発生し,取引が頻発する可能性があります.EMA周期パラメータを適切に調整したり,RSIフィルタリング条件を追加したりできます.
- 状況が急激に逆転すると,EMA交差信号は遅滞し,間に合わずに停止することがあります.他の指標と組み合わせて,空調信号の強さを判断することができます.
- 利益目標と止損幅の設定は不適切であり,早期の止損または早期の止損が発生する可能性があります.異なる品種特性と市場環境のパラメータに応じて最適化する必要があります.
戦略最適化の方向性
この戦略は以下の方向から最適化できます.
- 取引品種のパラメータ最適化を追加し,異なる品種に対して最適なパラメータの組み合わせを設定する
- KDJ,MACDなどの他の指標判断を加え,多要素モデルを形成する
- 機械学習による風制御手段を増やし,モデルによる信号品質判断を行い,誤判の可能性を低減する
- 感情面分析と組み合わせて,極端な感情によって誤った取引を避ける
- 異なるストップ・ストップ・ストラスト戦略をテストし,最適なパラメータを探します.
要約する
この戦略は,全体として,信頼性の高い,実行しやすいトレンド追跡戦略である.それは,多周期EMAを交叉してトレンドの方向を判断し,RSIフィルター偽信号と組み合わせて,反測効果の良い基礎でパラメータ最適化とモデル最適化を行う.安定した収益を期待する.しかし,トレーダーは,使用するときに,依然として,動きの逆転とパラメータ不適切なリスクをもたらす警戒が必要です.
ストラテジーソースコード
/*backtest
start: 2024-01-30 00:00:00
end: 2024-02-29 00:00:00
period: 3h
basePeriod: 15m
exchanges: [{"eid":"Futures_Binance","currency":"BTC_USDT"}]
*/

// This source code is subject to the terms of the Mozilla Public License 2.0 at https://mozilla.org/MPL/2.0/
// © Ravikant_sharma

//@version=5

strategy('new', overlay=true)

start = timestamp(1990, 1, 1, 0, 0)
end = timestamp(2043, 12, 12, 23, 59)
ema0 = ta.ema(close, 9)
ema1 = ta.ema(close, 21)
ema2 = ta.ema(close, 51)
ema3 = ta.ema(close, 100)
ema4 = ta.ema(close, 200)

rsi2=ta.rsi(ta.sma(close,14),14)
plot(ema0, '9', color.new(color.green, 0))
plot(ema1, '21', color.new(color.black, 0))
plot(ema2, '51', color.new(color.red, 0))
plot(ema3, '200', color.new(color.blue, 0))

//plot(ema4, '100', color.new(color.gray, 0))


//LongEntry = (  ta.crossover(ema0,ema3)  or  ta.crossover(ema0,ema2) or  ta.crossunder(ema2,ema3) ) // ta.crossover(ema0,ema1) //
LongEntry=false
if ta.crossover(ema0,ema1)
    if rsi2>65
        LongEntry:=true
if ta.crossover(ema1,ema2)
    if rsi2>65
        LongEntry:=true

LongExit =  ta.crossunder(ema0,ema2) or close >(strategy.position_avg_price*1.25) or rsi2 <40 or close < (strategy.position_avg_price*0.98)


if time >= start and time <= end
    if(LongEntry and rsi2>60)
        strategy.entry('Long', strategy.long, 1)
    if(LongExit)
        strategy.close('Long')