確率的RSIとEMAのクロスオーバーに基づく暗号通貨のリトレースメント取引戦略

戦略概要
この戦略は、ストキャスティックRSIとEMAを組み合わせてトレンドを検出し、取引シグナルを検証します。価格がEMA20よりも上でEMA9とEMA14の間に戻った際、同時にストキャスティックRSIが売られ過ぎの水準を下回った場合にロングシグナルを生成します。価格がEMA20よりも下でEMA9とEMA14の間に戻った際、同時にストキャスティックRSIが買われ過ぎの水準を上回った場合にショートシグナルを生成します。
戦略の原理
- ta.ema関数を使用して、異なる期間の3本のEMAライン(EMA9、EMA14、EMA20)を計算し、価格のトレンド状態を判断します。
- ta.rsi関数でRSI指標を計算し、さらにta.stoch関数でRSIをストキャスティックRSI指標に変換し、価格が買われ過ぎまたは売られ過ぎかどうかを判断します。
- 終値 > EMA20 かつ 終値 < EMA9 かつ 終値 < EMA14、同時にストキャスティックRSI < 売られ過ぎ水準の場合、ロングシグナルが発生し、買い操作を実行します。
- 終値 < EMA20 かつ 終値 > EMA9 かつ 終値 > EMA14、同時にストキャスティックRSI > 買われ過ぎ水準の場合、ショートシグナルが発生し、売り操作を実行します。
この戦略の核心理念は、ストキャスティックRSIを使用して、メイントレンド(EMA20で示される)における価格の押し目や戻りが適切な買われ過ぎ・売られ過ぎエリアに達したかを判断し、同時に短期EMAと中期EMAで押しの強さを検証することです。価格が短期EMAと中期EMAを超えてブレイクした場合、押し目が終了しトレンドが反転する可能性があり、その場合はエントリーに適しません。価格がEMA9とEMA14の間に戻った場合のみ、順張りでのエントリーを検討します。このように複数の条件で検証することで、シグナルの品質を効果的に高め、誤判定を減らすことができます。
戦略の利点
- トレンド系指標(EMA)とオシレーター系指標(RSI)を組み合わせることで、トレンドと買われ過ぎ・売られ過ぎのタイミングをより的確に捉えることができます。
- ストキャスティックRSIを採用しており、オリジナルのRSI指標と比較して2つの利点があります。1つは指標の平滑性が向上すること、もう1つは指標が極値領域に長時間張り付くのを防げることです。
- 複数の条件による検証により、多くの偽シグナルを効果的にフィルタリングし、シグナルの信頼性を高めます。
- コードのロジックが明確でシンプルであり、理解や修正が容易なため、初心者が学習するためのテンプレートとして活用できます。
戦略のリスク
- レンジ相場には適しません。その場合、EMAの頻繁なクロスにより多くの偽シグナルが発生する可能性があります。
- トレンドが非常に強い場合、価格が一方的に上昇または下落するため、押し目が浅く、この戦略では多くの機会を逃すことになります。
- EMAパラメータの選択が戦略に大きな影響を与えます。異なる品种や時間足ごとに個別に調整する必要があります。
- ストキャスティックRSIのパラメータも実際の状況に応じて調整する必要があります。現在のデフォルト値では、一部の品种で効果が不十分な場合があります。
改善の方向性
- ATR指標を導入して買われ過ぎ・売られ過ぎ水準を動的に調整し、異なるボラティリティに対応することを検討できます。
- 異なる期間のEMAをさらに追加し、価格の押し目位置をより細かく記述することが可能です。
- ストップロスと利確も必ず考慮すべきです。パーセンテージベースのストップロスやATRベースのストップロス、トレーリングストップで利益を保護する方法などがあります。
- ローソク足の形状(ピンバー、包み足など)を利用してトレンド転換を補助的に判断し、追加条件として精度を高めることができます。
まとめ
この戦略は、ストキャスティックRSIとEMAを用いた複数条件の検証によって、トレンドの押し目を捉えると同時にリスクを効果的にコントロールします。全体的な考え方はシンプルで分かりやすく、初心者が学習・使用するのに適しています。ただし、この戦略自体にもいくつかの限界があり、例えばレンジ相場でのパフォーマンスが悪い、強いトレンド相場での捕捉が不十分などの点があるため、実際の状況に応じてパラメータを柔軟に調整する必要があります。今後は、動的パラメータ、より多くの指標による検証、資金管理などの面から戦略を最適化・向上させ、より安定した収益を得ることが期待できます。総じて、この戦略は基本テンプレートとして、その上で修正や拡張を行うことができ、優れた出発点および学習素材となります。
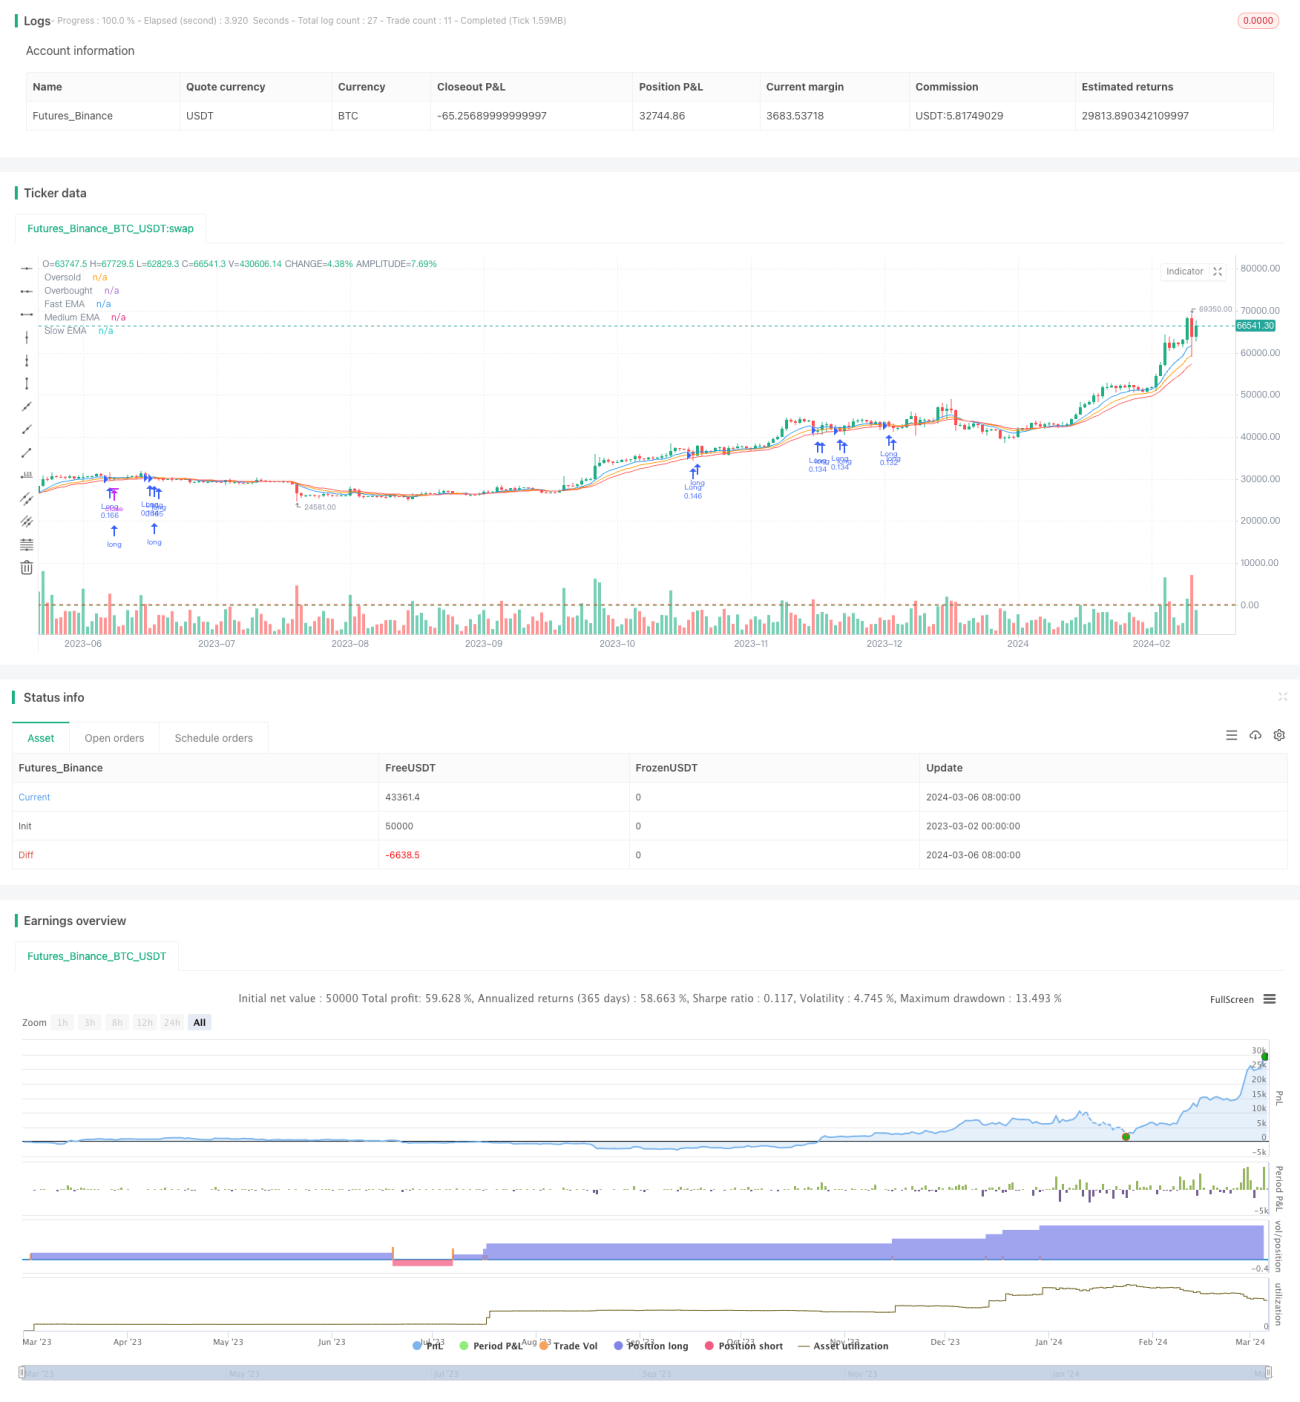
/*backtest
start: 2023-03-02 00:00:00
end: 2024-03-07 00:00:00
period: 1d
basePeriod: 1h
exchanges: [{"eid":"Futures_Binance","currency":"BTC_USDT"}]
*/

//@version=5
strategy("Crypto-EMA_Pullback=-", overlay=true,initial_capital = 10000000,default_qty_type=strategy.percent_of_equity, default_qty_value=10.0, pyramiding = 10)

// Inputs- 1